Energy: prices, power and the planet
What energy costs, where Britain’s electricity comes from, how clean it is, and how the UK compares with other countries.
Suits: Geography, science, economics, citizenship, maths and statistics. Questions at GCSE and A-level. Rebuilt every night from the latest figures.
Great Britain, September 2026.
Of electricity, September 2026.
Grams of CO₂ for each kilowatt-hour.
On a year earlier, August 2026.
Words to know
- Kilowatt-hour (kWh)
- The unit electricity is sold in: 1,000 watts for one hour.
- Carbon intensity
- Grams of carbon dioxide released per kilowatt-hour of electricity.
- Renewable energy
- Energy from sources that do not run out, such as wind, sun and water.
- Energy price cap
- A limit on the unit prices suppliers can charge, set by the regulator Ofgem.
- The grid
- The network that carries electricity from where it is made to where it is used.
- Net imports
- Energy bought from abroad minus energy sold abroad.
Charts
index, 2015 = 100. Electricity, gas and all prices, with 2015 set to 100. January 2015 to August 2026.
Source: ONS, Consumer price inflation
% of electricity generated. Share of Great Britain's electricity, by month. November 2023 to September 2026.
Source: NESO Carbon Intensity API (National Energy System Operator)
grams of CO₂ per kilowatt-hour. Carbon intensity of electricity, by month. November 2023 to September 2026.
1Highest: 171 in November 2024. 2Lowest: 84 in August 2024.
Source: NESO Carbon Intensity API (National Energy System Operator)
% a year. Home energy prices on a year earlier. September 2016 to August 2026.
1Highest: 89.7% in October 2022. 2Lowest: -27.2% in June 2024.
Source: ONS, Consumer price inflation
% a year. Petrol prices on a year earlier. September 2016 to August 2026.
1Highest: 42.9% in July 2022. 2Lowest: -24.4% in July 2023.
Source: ONS, Consumer price inflation
% of electricity. Great Britain, monthly average.
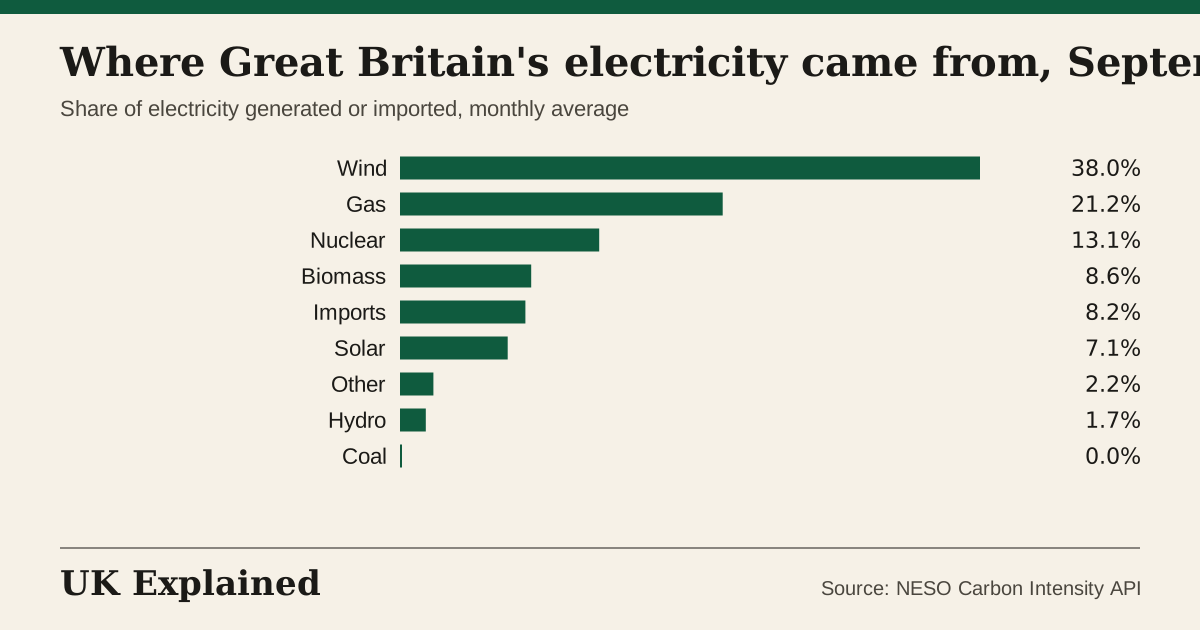
Source: NESO Carbon Intensity API
% of electricity output. The UK against 15 other economies.
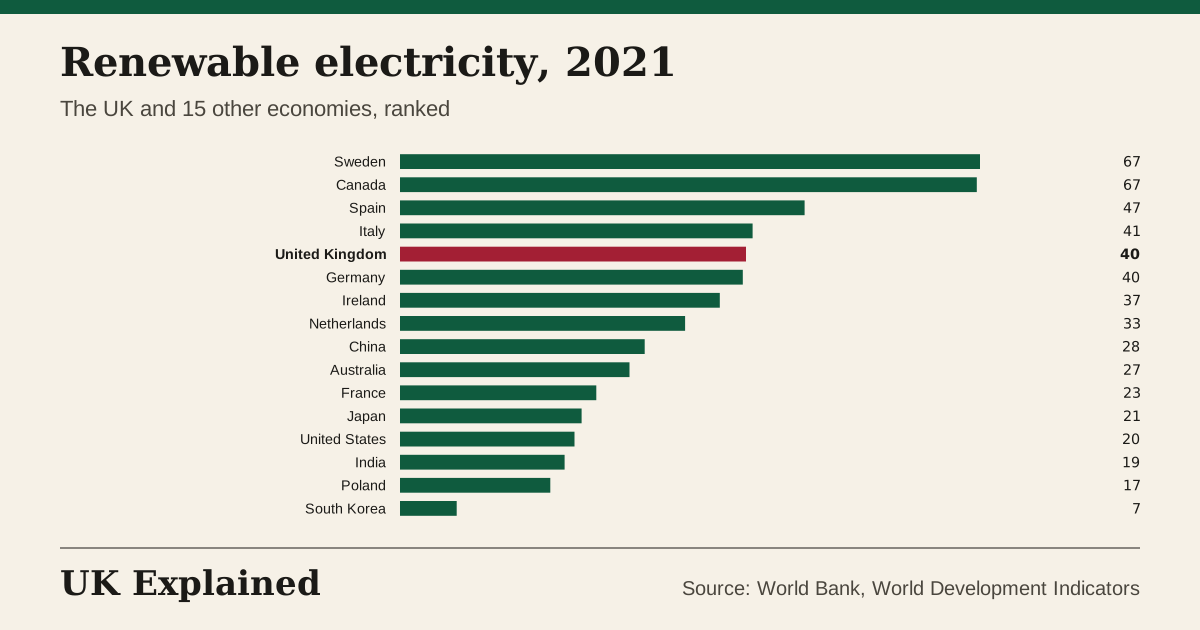
Source: World Bank
Great Britain’s electricity mix, last twelve months
| Month | Wind | Gas | Nuclear | Solar | Low-carbon | g CO₂ per kWh |
|---|---|---|---|---|---|---|
| September 2026 | 38% | 21% | 13% | 7% | 68% | 108 |
| August 2026 | 24% | 24% | 15% | 11% | 60% | 124 |
| July 2026 | 24% | 23% | 11% | 14% | 57% | 121 |
| June 2026 | 28% | 27% | 10% | 11% | 56% | 133 |
| May 2026 | 25% | 23% | 11% | 11% | 57% | 123 |
| April 2026 | 33% | 18% | 18% | 10% | 69% | 94 |
| March 2026 | 37% | 25% | 12% | 6% | 62% | 117 |
| February 2026 | 39% | 30% | 12% | 2% | 60% | 137 |
| January 2026 | 40% | 32% | 11% | 1% | 59% | 144 |
| December 2025 | 42% | 26% | 11% | 1% | 62% | 120 |
| November 2025 | 41% | 29% | 11% | 2% | 63% | 126 |
| October 2025 | 37% | 31% | 11% | 3% | 58% | 138 |
Monthly averages of every half hour. Great Britain only. Low-carbon is wind, solar, hydro, biomass and nuclear.
Questions
- Write down[2]
Write down the electricity price index in January 2020 and in August 2026. Use the chart of electricity, gas and all prices.
GCSE Maths · AQA 8300 · Statistics: interpreting line graphs of time seriesAnswer. 125 and 194B1 for 125 (±2). B1 for 194 (±2). Exact values: 125.2 and 194.0.Common error: Reading the line for gas or all prices. - Work out[3]
Work out the percentage increase in the electricity price index from 125.2 (January 2020) to 194.0 (August 2026). Give your answer to 1 decimal place.
GCSE Maths · AQA 8300 · Number: percentage changeAnswer. 55.0%M1 for (194.0 − 125.2) ÷ 125.2 or 194.0 ÷ 125.2. M1 for × 100 (or − 1). A1 for 55.0.Common error: Dividing by 194.0 instead of the original value. - Work out[3]
A household's electricity bill was £1 000 in January 2020. Assume it rises in line with the electricity price index. Work out the bill in August 2026.
GCSE Maths · AQA 8300 · Ratio, proportion and rates of change: multipliersAnswer. £1,550M1 for the multiplier 194.0 ÷ 125.2 = 1.5495. M1 for × 1 000. A1 for £1,549.52, accept £1,550.Common error: Adding the percentage increase to £1 000 twice. - Write[2]
Write the ratio of the electricity index to the all-prices index for August 2026 (194.0 : 143.6) in the form 1 : n. Give n to 2 decimal places.
GCSE Maths · AQA 8300 · Ratio, proportion and rates of change: ratios in the form 1 : nAnswer. 1 : 0.74M1 for 143.6 ÷ 194.0. A1 for 0.74.Common error: Giving the reverse ratio. - Calculate[2]
Calculate the mean carbon intensity for the 12 months in the table. Give your answer to 1 decimal place.
GCSE Maths · AQA 8300 · Statistics: averages from a tableAnswer. 123.8 g per kWhM1 for the sum 1,485 ÷ 12. A1 for 123.8.Common error: Dividing by 11. - Describe[3]
Describe how the share of electricity from wind changed between November 2023 and September 2026. Use the chart of where Great Britain's electricity comes from.
GCSE Geography · The challenge of resource management: energy supply (AQA 8035 Paper 2)Answer. Up 5.4 points overall, with big month-to-month swingsB1 overall change: 32.6% to 38.0%. B1 no steady trend: it moves between about 20% and 43%. B1 data support, e.g. low of 20% in May 2024, high of 43% in December 2023.Common error: Describing only the start and end values. - Explain[2]
Explain one reason why the share of electricity from wind changes from month to month.
GCSE Physics · Energy resources: renewable sources and their reliabilityAnswer. Wind speed varies with the weatherB1 wind speed changes with the weather and season. B1 turbines produce more when it is windier, so output is higher in windy winter months and low in calm spells. Accept maintenance or demand. - State[2]
State the relationship between the share of electricity from gas and the carbon intensity, using evidence from the charts.
GCSE Maths · AQA 8300 · Statistics: describing relationships between variablesAnswer. Positive: more gas, higher carbon intensityB1 positive relationship. B1 evidence, e.g. the highest intensity (171 g, November 2024) came with gas at 38%; the lowest (84 g, August 2024) with gas at 17%.Common error: Saying gas causes it with no evidence. - Calculate[4]
Calculate the real change in electricity prices from January 2015 (electricity 100.2, all prices 99.3) to August 2026 (electricity 194.0, all prices 143.6).
A-level Economics · AQA 7136, Edexcel 9EC0 · Real and nominal values; index numbersAnswer. +33.9% in real termsM1 for deflating: 194.0 ÷ 100.2 = 1.936 and 143.6 ÷ 99.3 = 1.446. M1 for dividing 1.936 ÷ 1.446. A1 for +33.9%. B1 interpretation: electricity rose faster than prices generally. (Nominal 93.6%, prices 44.6%.)Common error: Subtracting the percentage rises. - Distinguish[9]
Distinguish between cost-push and demand-pull inflation, then analyse which better explains the rise in energy prices from July 2021 to January 2023 (gas up 169%, electricity up 82%, all prices up 14%).
A-level Economics · AQA 7136, Edexcel 9EC0 · Causes of inflation; aggregate demand and aggregate supplyAnswer. Cost-push explains most; demand-pull played a small partAO1 (2): cost-push is rising costs of production, shifting SRAS left; demand-pull is AD growth beyond capacity. AO2 (4): gas index 84.9 → 228.2 while all prices rose 14%; energy is an input cost, and the one-month jump of 99.5 → 165.9 in April 2022 fits a supply shock, not gradual demand. AO3 (3): some demand-pull from post-lockdown recovery; second-round effects through wages; a judgement on relative importance. Levels: L1 (1–3) relevant points, little analysis; L2 (4–6) developed chains of reasoning; L3 (7–9) well-developed analysis, supported by the data, with a clear line of argument. - Explain[6]
Home energy has a weight of 3.2% in the CPI. Explain two reasons why a rise in energy prices may hurt low-income households more than the headline rate suggests.
A-level Economics · AQA 7136, Edexcel 9EC0 · Measuring inflation: CPI weights and distributionAnswer. Energy is a necessity and a larger share of low incomesEach developed reason: 1 mark to identify, up to 2 to develop (cause and effect, with data). e.g. (1) energy is a necessity with inelastic demand, so low-income households cannot cut back and spend a larger share of income on it. (2) the 3.2% weight is an average across all households; for lower-income households the true weight is higher, so their own inflation is higher. Also: less ability to insulate or switch; prepayment meter premiums.Common error: Saying energy is 'a small part of CPI' so it does not matter. - Evaluate[15]
Evaluate whether the Bank of England should 'look through' an energy-price shock when setting interest rates. Use the chart of electricity, gas and all prices in your answer.
A-level Economics · AQA 7136, Edexcel 9EC0 · Monetary policy and the inflation targetAnswer. A reasoned judgement with criteriaLevels: L1 (1–3) knowledge, no application; L2 (4–8) analysis of one side, some data; L3 (9–12) two-sided analysis with chains of reasoning and data; L4 (13–15) sustained evaluation with criteria (size, time, context) and a justified conclusion. Indicative: the 2% CPI target and transmission of the base rate with lags; a cost-push shock cannot be fixed by higher rates, which cut AD and raise unemployment. For looking through: the shock is temporary (gas index fell from 228 in January 2023 to between 137 and 160 in the last 18 months). Against: second-round effects, wage-price spiral, expectations, credibility. Criteria: size and persistence, labour-market tightness, expectations.Common error: Answering 'should rates rise?' without the idea of looking through. - Interpret[6]
Over the 35 months in the charts, the product moment correlation coefficient is r = +0.96 between gas share and carbon intensity, and r = -0.04 between wind share and carbon intensity. (a) Test, at the 5% level, for positive correlation between gas share and carbon intensity. The critical value is 0.2826 (one-tailed, n = 35). [4] (b) Say what r = -0.04 does and does not show about wind. [2]
A-level Maths · Statistics: correlation and hypothesis testingAnswer. (a) Reject H₀: positive correlation. (b) Not evidence that wind has no effect(a) B1 H₀: ρ = 0, H₁: ρ > 0. M1 compare r = 0.958 with 0.2826. A1 0.958 > 0.2826, so reject H₀. A1 conclusion in context. (b) B1 |-0.04| is below the critical value (0.3338 two-tailed): no linear association in monthly averages. B1 it does not show wind cannot lower intensity: gas, imports, nuclear and demand also vary, and monthly averages hide half-hourly links.Common error: Concluding that wind has no effect. - Assess[12]
Assess the extent to which expanding renewable generation can improve a country's energy security. Use the ranked chart and the fact that the UK's net energy imports were 44% of its energy use in 2023.
A-level Geography · Energy security and resource management (check your board)Answer. A reasoned judgement on energy securityLevels: L1 (1–3) a few relevant points; L2 (4–6) analysis, one-sided or unsupported; L3 (7–9) developed analysis with data and some judgement; L4 (10–12) balanced, evidence-based judgement that answers the question. Indicative: energy security means reliable, affordable supply. For: renewables cut fuel imports, reduce exposure to gas price shocks, domestic supply. Against: intermittency (wind 20–43% month to month), need for storage and interconnectors (8% of electricity imported in September 2026), grid costs, supply-chain and mineral dependence. Chart: Sweden and Canada are high mainly through hydro, a geographic advantage. Conclusion should depend on storage, mix and demand.Common error: Treating renewable and low-carbon as the same thing.
Ideas for discussion
- Is it fair that people with big homes or long journeys pay more when energy prices rise? What could be done?
- Which would you want more of near you: wind turbines, solar farms or a nuclear power station? What would you want to know first?
- Why might a country with lots of rivers find it easier to have clean electricity?
Answer sheet: Energy
- Write down[2]
125 and 194
B1 for 125 (±2). B1 for 194 (±2). Exact values: 125.2 and 194.0.Common error: Reading the line for gas or all prices. - Work out[3]
55.0%
M1 for (194.0 − 125.2) ÷ 125.2 or 194.0 ÷ 125.2. M1 for × 100 (or − 1). A1 for 55.0.Common error: Dividing by 194.0 instead of the original value. - Work out[3]
£1,550
M1 for the multiplier 194.0 ÷ 125.2 = 1.5495. M1 for × 1 000. A1 for £1,549.52, accept £1,550.Common error: Adding the percentage increase to £1 000 twice. - Write[2]
1 : 0.74
M1 for 143.6 ÷ 194.0. A1 for 0.74.Common error: Giving the reverse ratio. - Calculate[2]
123.8 g per kWh
M1 for the sum 1,485 ÷ 12. A1 for 123.8.Common error: Dividing by 11. - Describe[3]
Up 5.4 points overall, with big month-to-month swings
B1 overall change: 32.6% to 38.0%. B1 no steady trend: it moves between about 20% and 43%. B1 data support, e.g. low of 20% in May 2024, high of 43% in December 2023.Common error: Describing only the start and end values. - Explain[2]
Wind speed varies with the weather
B1 wind speed changes with the weather and season. B1 turbines produce more when it is windier, so output is higher in windy winter months and low in calm spells. Accept maintenance or demand. - State[2]
Positive: more gas, higher carbon intensity
B1 positive relationship. B1 evidence, e.g. the highest intensity (171 g, November 2024) came with gas at 38%; the lowest (84 g, August 2024) with gas at 17%.Common error: Saying gas causes it with no evidence. - Calculate[4]
+33.9% in real terms
M1 for deflating: 194.0 ÷ 100.2 = 1.936 and 143.6 ÷ 99.3 = 1.446. M1 for dividing 1.936 ÷ 1.446. A1 for +33.9%. B1 interpretation: electricity rose faster than prices generally. (Nominal 93.6%, prices 44.6%.)Common error: Subtracting the percentage rises. - Distinguish[9]
Cost-push explains most; demand-pull played a small part
AO1 (2): cost-push is rising costs of production, shifting SRAS left; demand-pull is AD growth beyond capacity. AO2 (4): gas index 84.9 → 228.2 while all prices rose 14%; energy is an input cost, and the one-month jump of 99.5 → 165.9 in April 2022 fits a supply shock, not gradual demand. AO3 (3): some demand-pull from post-lockdown recovery; second-round effects through wages; a judgement on relative importance. Levels: L1 (1–3) relevant points, little analysis; L2 (4–6) developed chains of reasoning; L3 (7–9) well-developed analysis, supported by the data, with a clear line of argument. - Explain[6]
Energy is a necessity and a larger share of low incomes
Each developed reason: 1 mark to identify, up to 2 to develop (cause and effect, with data). e.g. (1) energy is a necessity with inelastic demand, so low-income households cannot cut back and spend a larger share of income on it. (2) the 3.2% weight is an average across all households; for lower-income households the true weight is higher, so their own inflation is higher. Also: less ability to insulate or switch; prepayment meter premiums.Common error: Saying energy is 'a small part of CPI' so it does not matter. - Evaluate[15]
A reasoned judgement with criteria
Levels: L1 (1–3) knowledge, no application; L2 (4–8) analysis of one side, some data; L3 (9–12) two-sided analysis with chains of reasoning and data; L4 (13–15) sustained evaluation with criteria (size, time, context) and a justified conclusion. Indicative: the 2% CPI target and transmission of the base rate with lags; a cost-push shock cannot be fixed by higher rates, which cut AD and raise unemployment. For looking through: the shock is temporary (gas index fell from 228 in January 2023 to between 137 and 160 in the last 18 months). Against: second-round effects, wage-price spiral, expectations, credibility. Criteria: size and persistence, labour-market tightness, expectations.Common error: Answering 'should rates rise?' without the idea of looking through. - Interpret[6]
(a) Reject H₀: positive correlation. (b) Not evidence that wind has no effect
(a) B1 H₀: ρ = 0, H₁: ρ > 0. M1 compare r = 0.958 with 0.2826. A1 0.958 > 0.2826, so reject H₀. A1 conclusion in context. (b) B1 |-0.04| is below the critical value (0.3338 two-tailed): no linear association in monthly averages. B1 it does not show wind cannot lower intensity: gas, imports, nuclear and demand also vary, and monthly averages hide half-hourly links.Common error: Concluding that wind has no effect. - Assess[12]
A reasoned judgement on energy security
Levels: L1 (1–3) a few relevant points; L2 (4–6) analysis, one-sided or unsupported; L3 (7–9) developed analysis with data and some judgement; L4 (10–12) balanced, evidence-based judgement that answers the question. Indicative: energy security means reliable, affordable supply. For: renewables cut fuel imports, reduce exposure to gas price shocks, domestic supply. Against: intermittency (wind 20–43% month to month), need for storage and interconnectors (8% of electricity imported in September 2026), grid costs, supply-chain and mineral dependence. Chart: Sweden and Canada are high mainly through hydro, a geographic advantage. Conclusion should depend on storage, mix and demand.Common error: Treating renewable and low-carbon as the same thing.
Sources: ONS (Consumer Prices Index), NESO (Carbon Intensity API), World Bank (World Development Indicators). See also: Energy · Electricity mix · Energy prices · Other countries.
Questions are original and follow the content areas and command words of GCSE and A-level specifications (AQA GCSE Maths 8300, AQA GCSE Geography 8035, A-level Economics AQA 7136 and Edexcel 9EC0 were checked; tags marked 'check your board' and other subjects use the usual content-area names). They are not past papers and no exam board has endorsed them. Mark schemes are indicative.