How does the UK’s energy compare with other countries?
40% of UK electricity came from renewable sources in 2021, the 5th highest of 16 economies (the middle of the others: 28%). Each person in the UK was responsible for 4.2 tonnes of carbon dioxide in 2024, and the UK met 56% of its own energy needs in 2023.
Of electricity output. The middle of the others is 28%.
Of energy used, bought from abroad. The middle of the others is 49%.
Tonnes a year. The middle of the others is 6.9.
Kilograms of oil equivalent. The middle of the others is 3,185.
Ranked, one measure at a time
Each list uses the latest year the World Bank has for most of the 16 countries. The United Kingdom is picked out in the bar colour.
Renewable electricity, 2021: UK 5th of 16
The share of a country's electricity made from renewable sources: wind, solar, hydro, biomass and others. % of electricity.
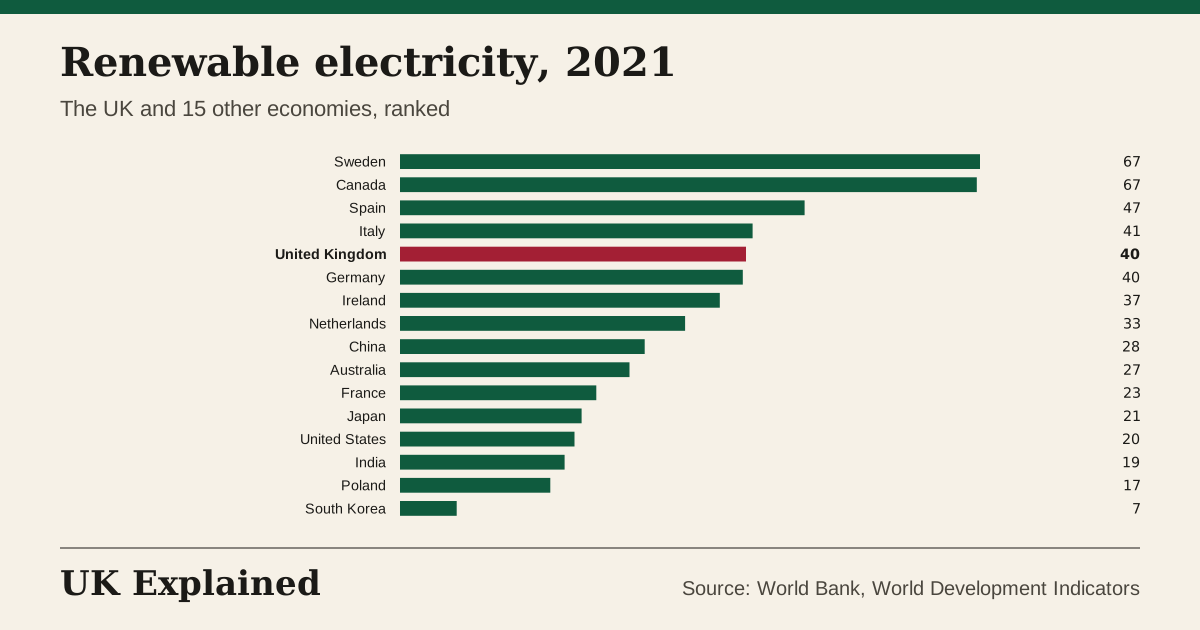
What it cannot tell you: A high share can come from hydro power, which depends on geography, so it does not show how fast a country is adding wind and solar.
Nuclear electricity, 2023: UK 7th of 12
The share of a country's electricity made in nuclear power stations. % of electricity.
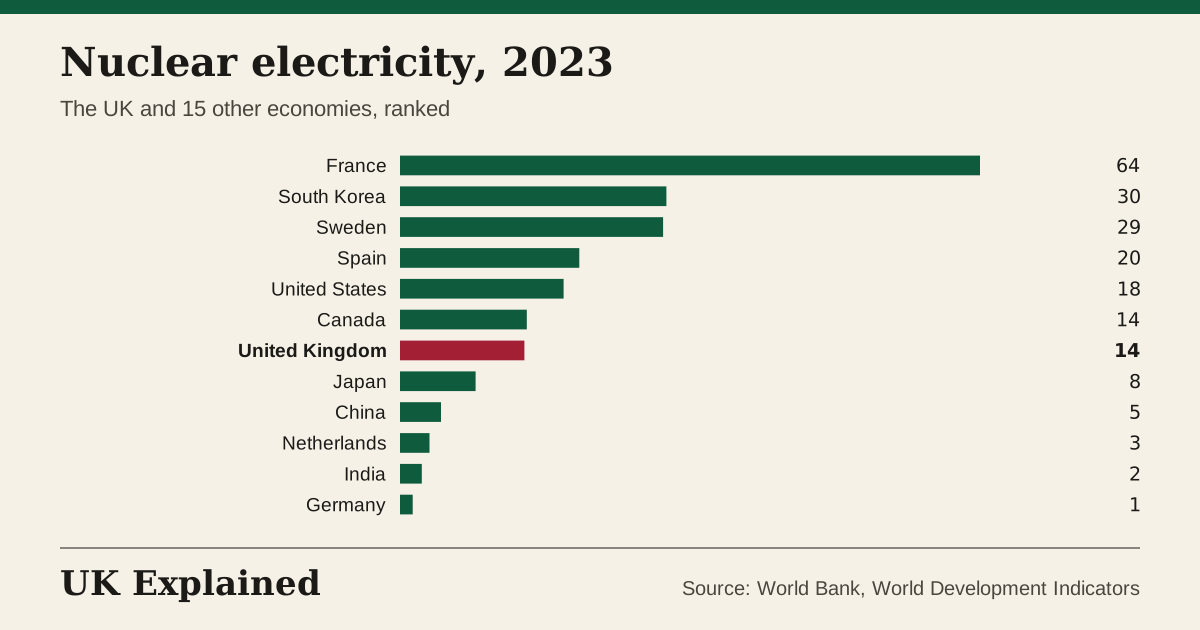
What it cannot tell you: It says nothing about cost, safety or waste, which are the heart of the debate about nuclear power.
Fossil fuel electricity, 2023: UK 12th of 16
The share of a country's electricity made by burning coal, oil or gas. % of electricity.
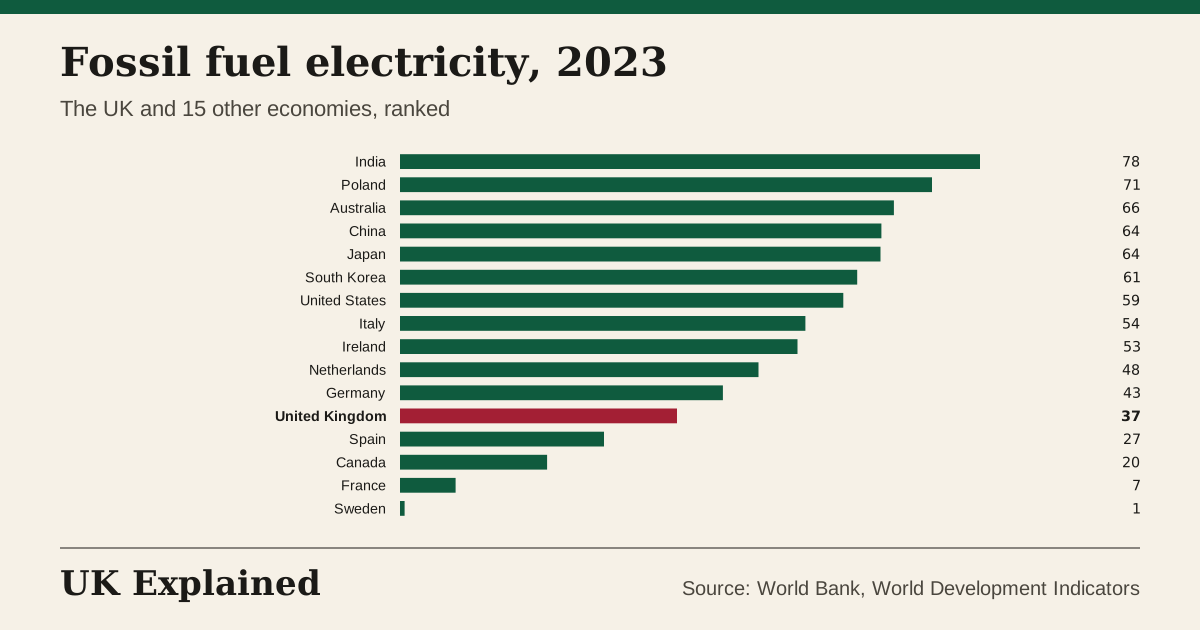
What it cannot tell you: Fossil fuels also supply heating and transport, which this does not cover.
Renewable share of all energy, 2021: UK 12th of 16
The share of all the energy people and businesses use (electricity, heating and transport) that comes from renewable sources. % of final energy.
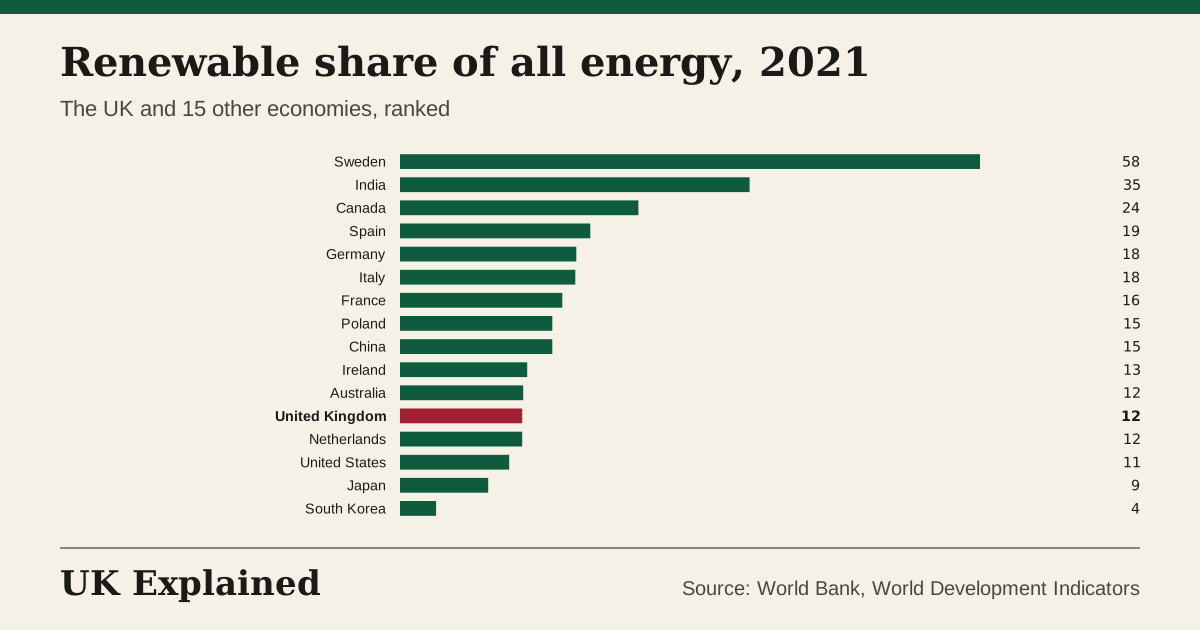
What it cannot tell you: It covers all uses, so it is much lower than the share of electricity alone.
Energy use per person, 2024: UK 14th of 14
How much energy a country uses for each person, in kilograms of oil equivalent a year. kg of oil equivalent.
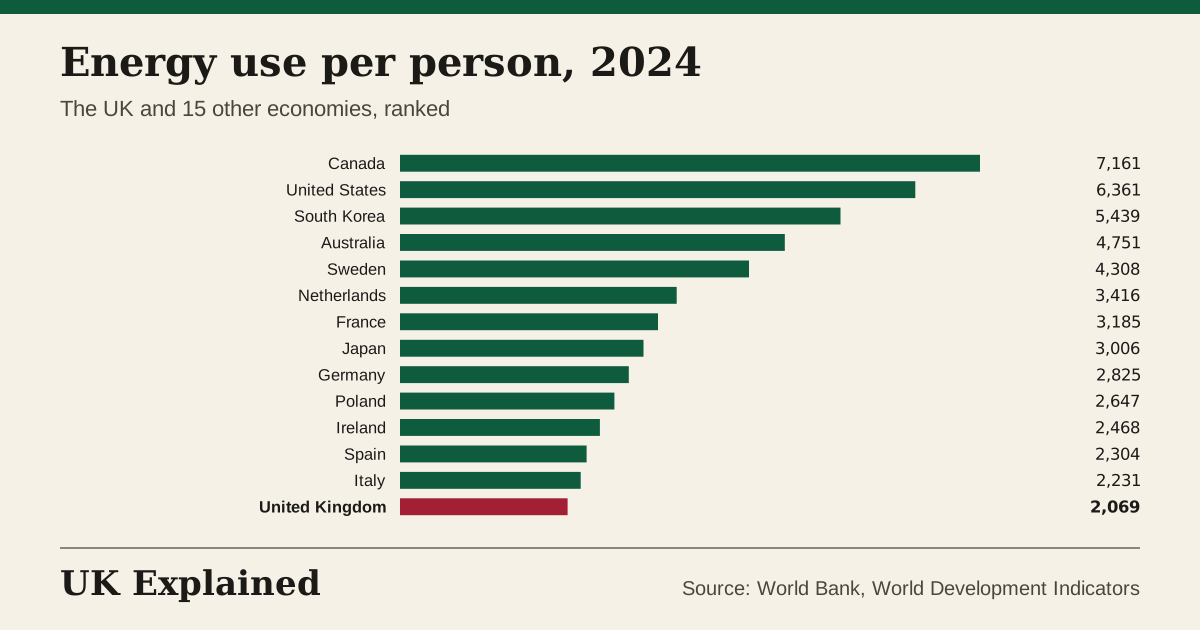
What it cannot tell you: A cold, large or industrial country uses more energy without wasting more.
Output per unit of energy, 2024: UK 2nd of 14
How much the economy produces for each kilogram of oil equivalent of energy used, adjusted for local prices. $ of GDP per kg of oil equivalent.
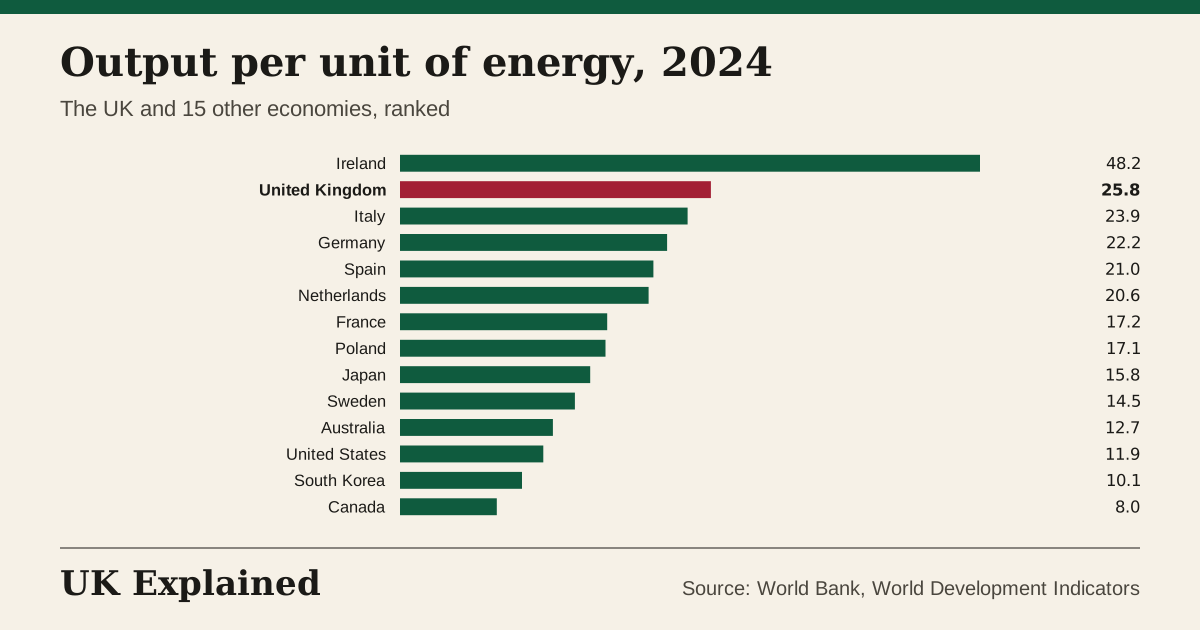
What it cannot tell you: It mixes how efficient homes and factories are with what the economy makes and what it imports.
Net energy imports, 2023: UK 10th of 16
Energy a country has to buy from abroad, minus what it sells, as a share of all the energy it uses. A minus sign means it exports more than it uses. % of energy use.
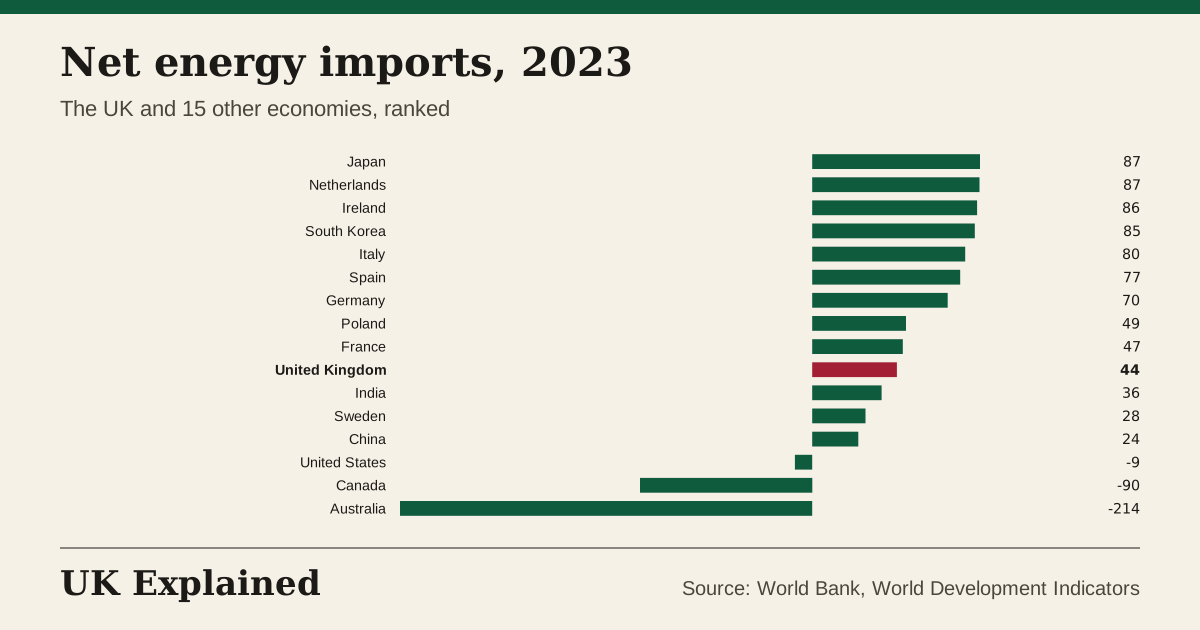
What it cannot tell you: It does not show how many countries supply the energy or how secure supply is.
Carbon dioxide per person, 2024: UK 13th of 16
Carbon dioxide released in each country per person, from fossil fuels, cement and other sources within its borders. tonnes.
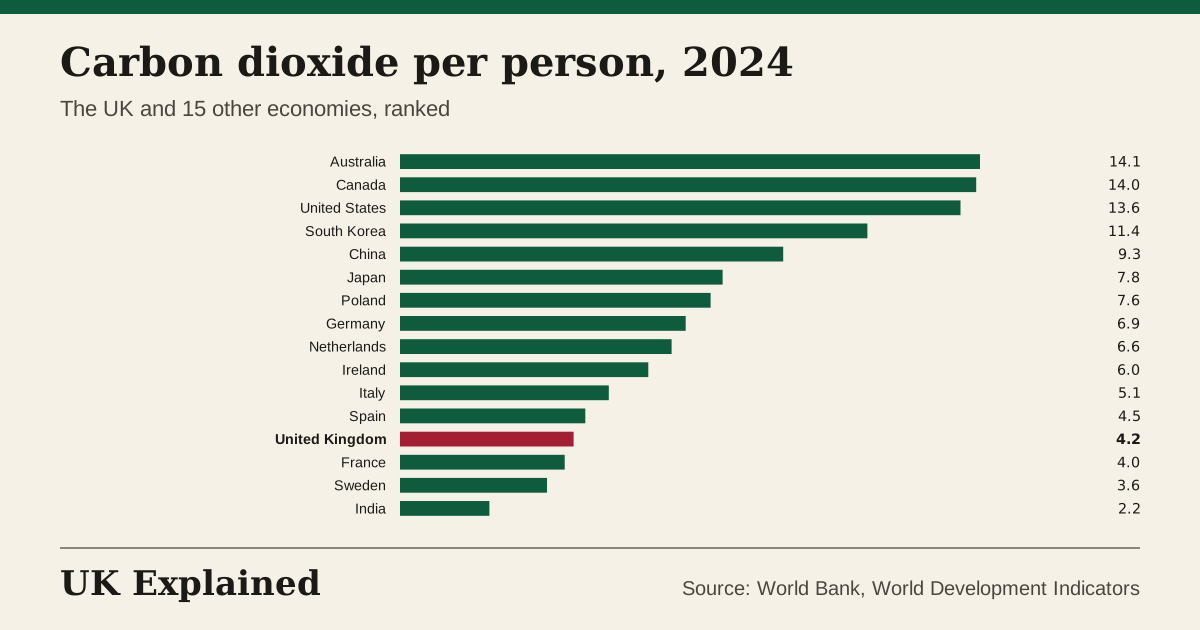
What it cannot tell you: It counts emissions made in the country, not those from goods made abroad and bought there.
All countries side by side
A dash means the World Bank reports no figure, usually because the country has no nuclear power. Select a heading to sort. Years: Renewable electricity 2021; Nuclear electricity 2023; Fossil fuel electricity 2023; Renewable share of all energy 2021; Energy use per person 2024; Output per unit of energy 2024; Net energy imports 2023; Carbon dioxide per person 2024. Download the table as CSV.
| Country | Renewable electricity | Nuclear electricity | Fossil fuel electricity | Renewable share of all energy | Energy use per person | Output per unit of energy | Net energy imports | Carbon dioxide per person |
|---|---|---|---|---|---|---|---|---|
| United Kingdom | 40 | 14 | 37 | 12 | 2,069 | 25.8 | 44 | 4.2 |
| Australia | 27 | – | 66 | 12 | 4,751 | 12.7 | -214 | 14.1 |
| Canada | 67 | 14 | 20 | 24 | 7,161 | 8.0 | -90 | 14.0 |
| China | 28 | 5 | 64 | 15 | – | – | 24 | 9.3 |
| France | 23 | 64 | 7 | 16 | 3,185 | 17.2 | 47 | 4.0 |
| Germany | 40 | 1 | 43 | 18 | 2,825 | 22.2 | 70 | 6.9 |
| India | 19 | 2 | 78 | 35 | – | – | 36 | 2.2 |
| Ireland | 37 | – | 53 | 13 | 2,468 | 48.2 | 86 | 6.0 |
| Italy | 41 | – | 54 | 18 | 2,231 | 23.9 | 80 | 5.1 |
| Japan | 21 | 8 | 64 | 9 | 3,006 | 15.8 | 87 | 7.8 |
| Netherlands | 33 | 3 | 48 | 12 | 3,416 | 20.6 | 87 | 6.6 |
| Poland | 17 | – | 71 | 15 | 2,647 | 17.1 | 49 | 7.6 |
| South Korea | 7 | 30 | 61 | 4 | 5,439 | 10.1 | 85 | 11.4 |
| Spain | 47 | 20 | 27 | 19 | 2,304 | 21.0 | 77 | 4.5 |
| Sweden | 67 | 29 | 1 | 58 | 4,308 | 14.5 | 28 | 3.6 |
| United States | 20 | 18 | 59 | 11 | 6,361 | 11.9 | -9 | 13.6 |
Questions people ask
Which country gets the most electricity from renewables?
Sweden at 67% in 2021; the UK is at 40%.
Does the UK depend on imported energy?
On the World Bank’s measure, net energy imports were 44% of the energy the UK used in 2023. A minus sign for a country means it sells more energy abroad than it uses.
How does UK carbon dioxide per person compare?
4.2 tonnes a person in 2024, 13th highest of 16. It counts emissions made inside the country, not those from goods made abroad and bought here.
Why are different years shown?
The World Bank publishes some energy measures with a delay of two or three years. We use the latest year for which at least 11 of the 16 countries have a figure. Renewable electricity 2021; Nuclear electricity 2023; Fossil fuel electricity 2023; Renewable share of all energy 2021; Energy use per person 2024; Output per unit of energy 2024; Net energy imports 2023; Carbon dioxide per person 2024.
Where do the figures come from?
The World Bank’s World Development Indicators, which draw on the International Energy Agency and national statistics, so every country is measured the same way.
Source: World Bank, World Development Indicators, fetched 2026-10-07. Updated every night.
See also: Energy · The UK against other countries · Where electricity comes from · Classroom pack