Where does Britain’s electricity come from?
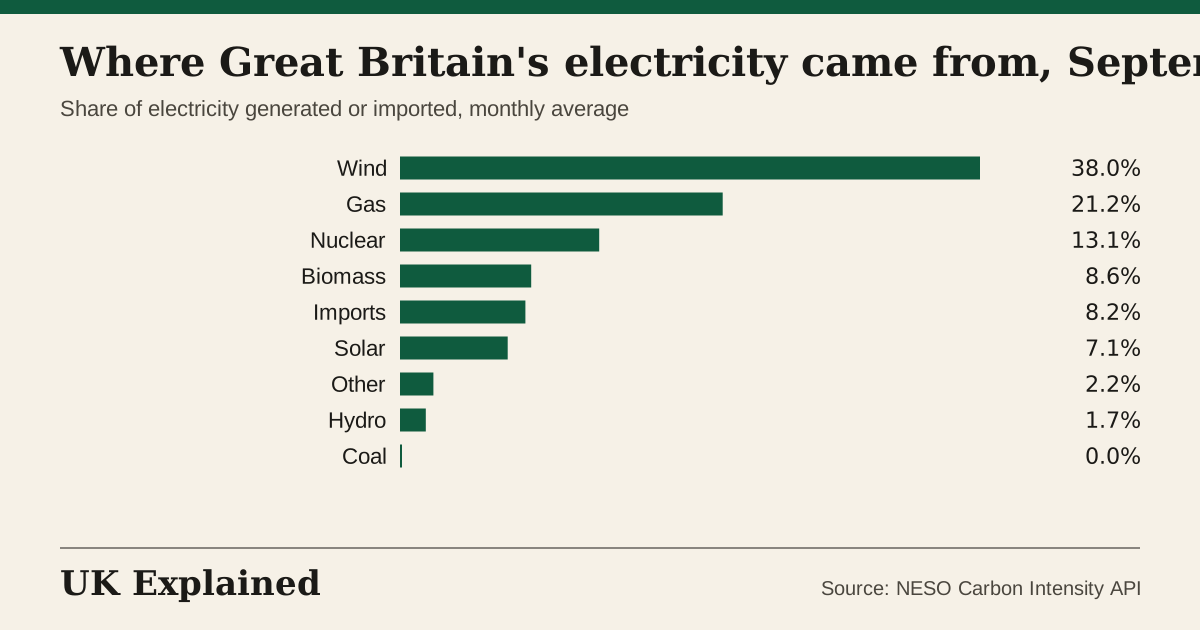
In September 2026, Great Britain’s electricity came from wind 38%, gas 21%, nuclear 13%, solar 7%, biomass 9%, hydro 2% and imports 8%. Low-carbon sources supplied 68% and each kilowatt-hour released 108 grams of carbon dioxide.
September 2026. ↑ Up 4 points on a year earlier.
September 2026. ↓ Down 1 point on a year earlier.
September 2026. ↓ Down 3 points on a year earlier.
Grams of CO₂ per kilowatt-hour. ↓ Down 4 g on a year earlier.
The mix in September 2026
Share of the electricity generated or imported, averaged over every half hour of the month.
The mix right now
The half hour from 2026-10-07 at 14:00 UTC. It changes with the weather and the time of day.
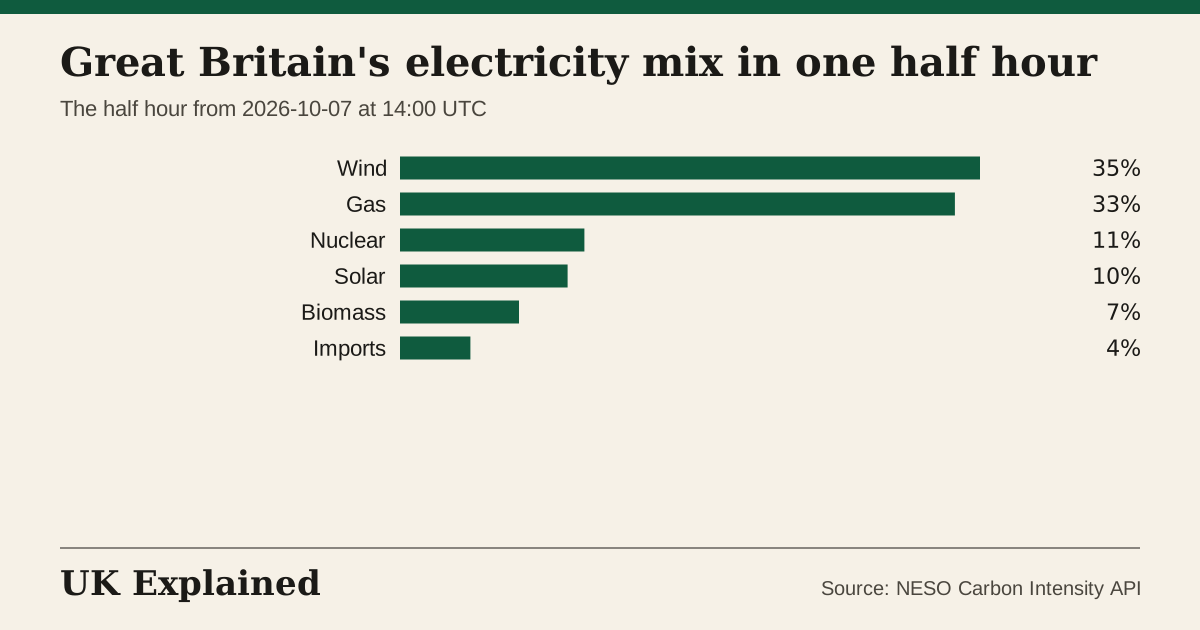
Carbon intensity then: 117 grams of CO₂ per kilowatt-hour (moderate).
The mix over time
What’s this?
The share of Great Britain's electricity made by wind turbines on land and at sea.
What it cannot tell you: It covers Great Britain (England, Scotland and Wales), not Northern Ireland, and shows the average over a month, so it hides big swings from hour to hour.
What’s this?
The share of Great Britain's electricity made in gas-fired power stations.
What it cannot tell you: It covers Great Britain (England, Scotland and Wales), not Northern Ireland, and shows the average over a month, so it hides big swings from hour to hour.
What’s this?
The share of Great Britain's electricity made from wind, solar, hydro, biomass and nuclear.
What it cannot tell you: It covers Great Britain (England, Scotland and Wales), not Northern Ireland, and shows the average over a month, so it hides big swings from hour to hour. Whether biomass counts as low-carbon is debated.
What’s this?
How much carbon dioxide is released, on average, for each kilowatt-hour of electricity generated in Great Britain, including imports.
What it cannot tell you: It covers Great Britain (England, Scotland and Wales), not Northern Ireland, and shows the average over a month, so it hides big swings from hour to hour.
What’s this?
The share of Great Britain's electricity made by solar panels that feed the national grid, with an estimate for panels on homes.
What it cannot tell you: It covers Great Britain (England, Scotland and Wales), not Northern Ireland, and shows the average over a month, so it hides big swings from hour to hour.
What’s this?
The share of Great Britain's electricity made in nuclear power stations.
What it cannot tell you: It covers Great Britain (England, Scotland and Wales), not Northern Ireland, and shows the average over a month, so it hides big swings from hour to hour.
How clean is each region right now?
A snapshot of the half hour from 2026-10-07 at 14:00 UTC, cleanest first. Regions are the 14 electricity distribution areas, and they trade power, so a clean region is not always running only on its own supply.
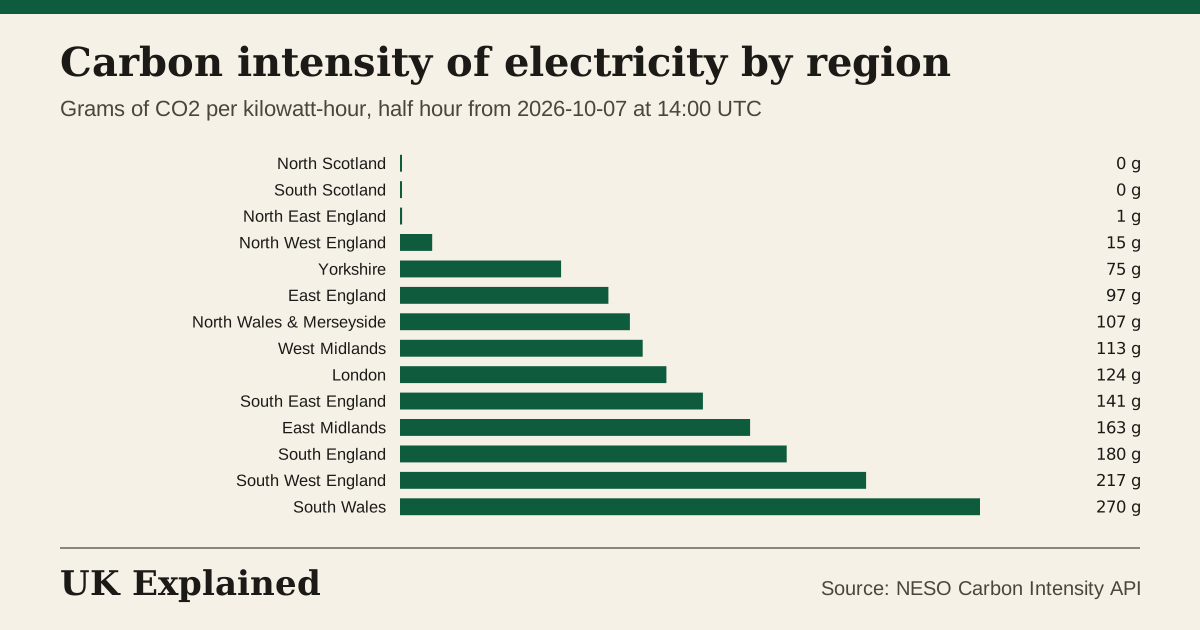
The same snapshot as a table
| Region | Grams of CO₂ per kWh | Rating | Wind | Gas | Nuclear | Solar |
|---|---|---|---|---|---|---|
| North Scotland | 0 | very low | 91% | 0% | 0% | 9% |
| South Scotland | 0 | very low | 60% | 0% | 33% | 7% |
| North East England | 1 | very low | 34% | 0% | 20% | 8% |
| North West England | 15 | very low | 44% | 3% | 31% | 8% |
| Yorkshire | 75 | low | 45% | 8% | 2% | 4% |
| East England | 97 | moderate | 47% | 23% | 17% | 6% |
| North Wales & Merseyside | 107 | moderate | 47% | 27% | 14% | 9% |
| West Midlands | 113 | moderate | 34% | 28% | 14% | 17% |
| London | 124 | moderate | 42% | 30% | 12% | 8% |
| South East England | 141 | moderate | 42% | 34% | 7% | 8% |
| East Midlands | 163 | moderate | 34% | 35% | 1% | 7% |
| South England | 180 | high | 26% | 43% | 5% | 15% |
| South West England | 217 | high | 12% | 55% | 0% | 32% |
| South Wales | 270 | very high | 18% | 68% | 0% | 14% |
Month by month
| Month | Wind | Gas | Nuclear | Solar | Low-carbon | g CO₂ per kWh |
|---|---|---|---|---|---|---|
| September 2026 | 38% | 21% | 13% | 7% | 68% | 108 |
| August 2026 | 24% | 24% | 15% | 11% | 60% | 124 |
| July 2026 | 24% | 23% | 11% | 14% | 57% | 121 |
| June 2026 | 28% | 27% | 10% | 11% | 56% | 133 |
| May 2026 | 25% | 23% | 11% | 11% | 57% | 123 |
| April 2026 | 33% | 18% | 18% | 10% | 69% | 94 |
| March 2026 | 37% | 25% | 12% | 6% | 62% | 117 |
| February 2026 | 39% | 30% | 12% | 2% | 60% | 137 |
| January 2026 | 40% | 32% | 11% | 1% | 59% | 144 |
| December 2025 | 42% | 26% | 11% | 1% | 62% | 120 |
| November 2025 | 41% | 29% | 11% | 2% | 63% | 126 |
| October 2025 | 37% | 31% | 11% | 3% | 58% | 138 |
Questions people ask
Where does UK electricity come from?
In September 2026: wind 38%, gas 21%, nuclear 13%, solar 7%, biomass 9%, hydro 2%, imports 8%, coal 0%. This is Great Britain; Northern Ireland has a separate grid.
How much of our electricity is renewable?
Wind, solar, hydro and biomass together supplied 55% in September 2026. Adding nuclear, low-carbon sources supplied 68%.
What is carbon intensity?
How many grams of carbon dioxide are released for each kilowatt-hour of electricity. In September 2026 it averaged 108 g. The cleanest month we show was August 2024 (84 g) and the dirtiest November 2024 (171 g).
When is the wind strongest?
Wind supplied the most in December 2023, an average of 43% of the month’s electricity. Wind output is usually higher in autumn and winter.
Does the UK still burn coal for electricity?
Coal supplied 0.0% in September 2026. Britain’s last coal-fired power station closed in 2024.
What counts as imports?
Electricity that came through cables from other countries, such as France, Norway and the Netherlands. Its carbon content depends on how it was made abroad.
Sources: NESO Carbon Intensity API, fetched 2026-10-07. Includes embedded generation such as rooftop solar as estimated by NESO. Updated every night.
See also: Energy · Energy against other countries · Energy prices · Everything over time