How does the UK's health system compare with other countries?
The UK spent 11.0% of GDP on health in 2023 (6th highest of the 16 economies we compare), with 3.1 doctors and 2.4 hospital beds for every 1,000 people.
Of GDP, public and private, 2023. 6th highest of the 16 economies we compare.
Per 1,000 people, 2022. 10th highest of the 14 economies we compare.
Per 1,000 people, 2022. 12th highest of the 14 economies we compare.
UK over time
What’s this?
All spending on health, public and private, as a share of everything the economy produces.
What it cannot tell you: More spending does not always mean better health, and countries with older populations spend more.
What’s this?
The number of doctors for every 1,000 people.
What it cannot tell you: It counts doctors, not their hours or where they work.
What’s this?
The number of hospital beds for every 1,000 people.
What it cannot tell you: Beds are not the same as staff or care, and countries organise care in hospitals and at home differently.
Against other countries
Ranked, using the latest year the World Bank has for most of the 16 economies. The United Kingdom is picked out in the bar colour. Countries differ in size, climate and how they collect the figures, so a rank is a starting point, not a verdict.
Spending on health, 2023: UK 6th of 16
All spending on health, public and private, as a share of everything the economy produces. % of GDP.
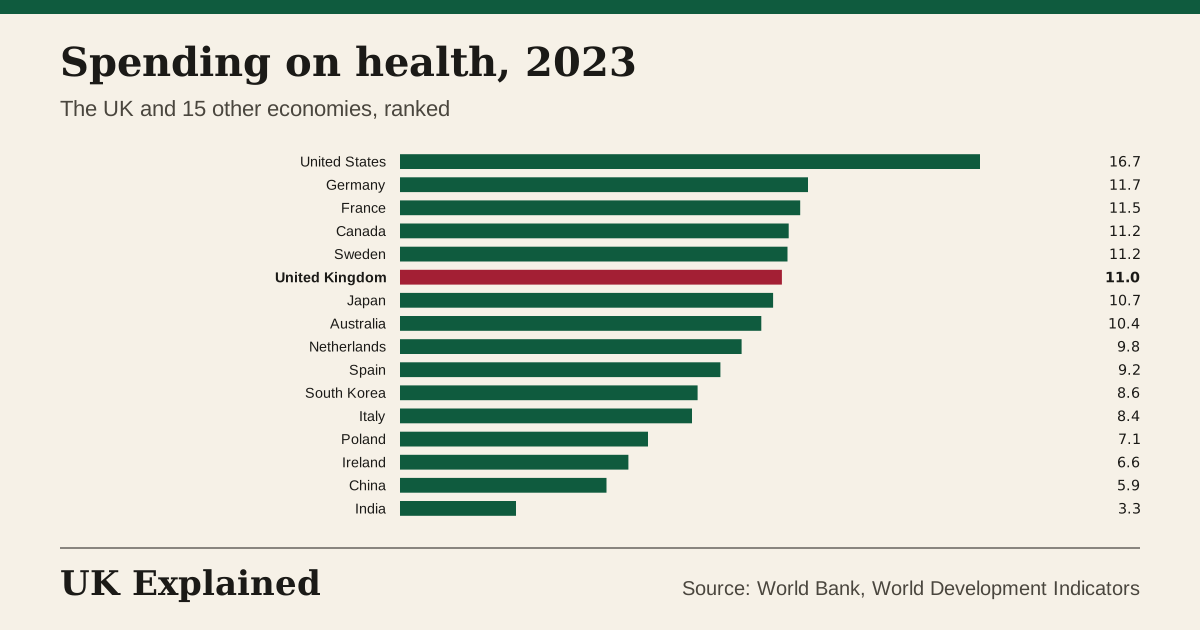
What it cannot tell you: More spending does not always mean better health, and countries with older populations spend more.
Doctors, 2022: UK 10th of 14
The number of doctors for every 1,000 people. per 1,000 people.
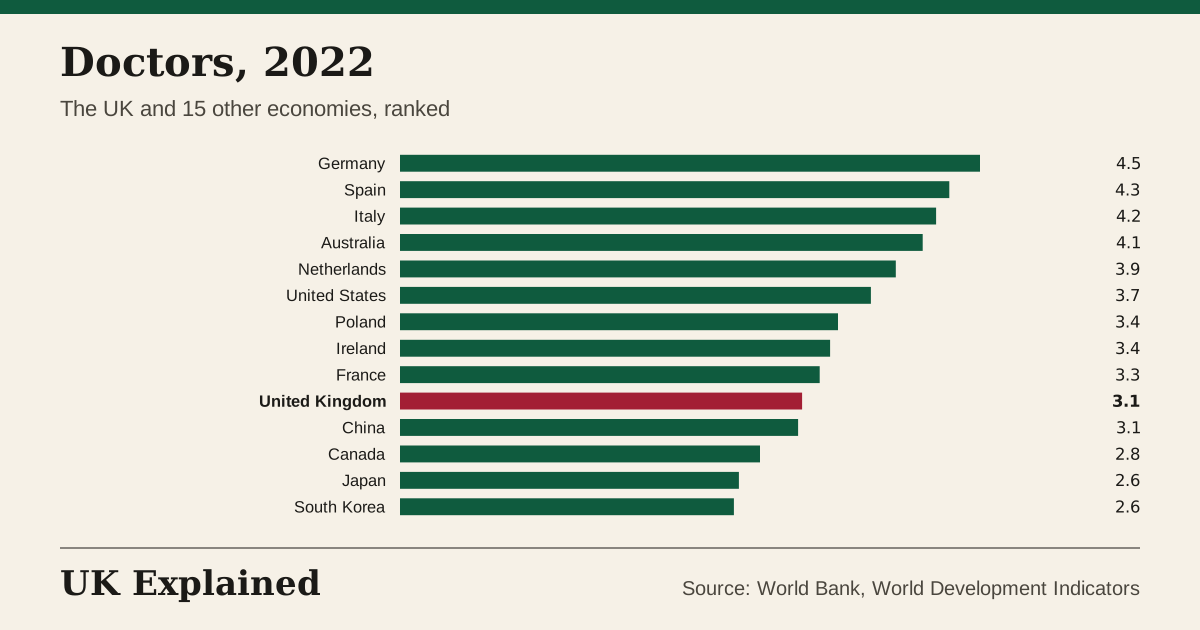
What it cannot tell you: It counts doctors, not their hours or where they work.
Hospital beds, 2022: UK 12th of 14
The number of hospital beds for every 1,000 people. per 1,000 people.
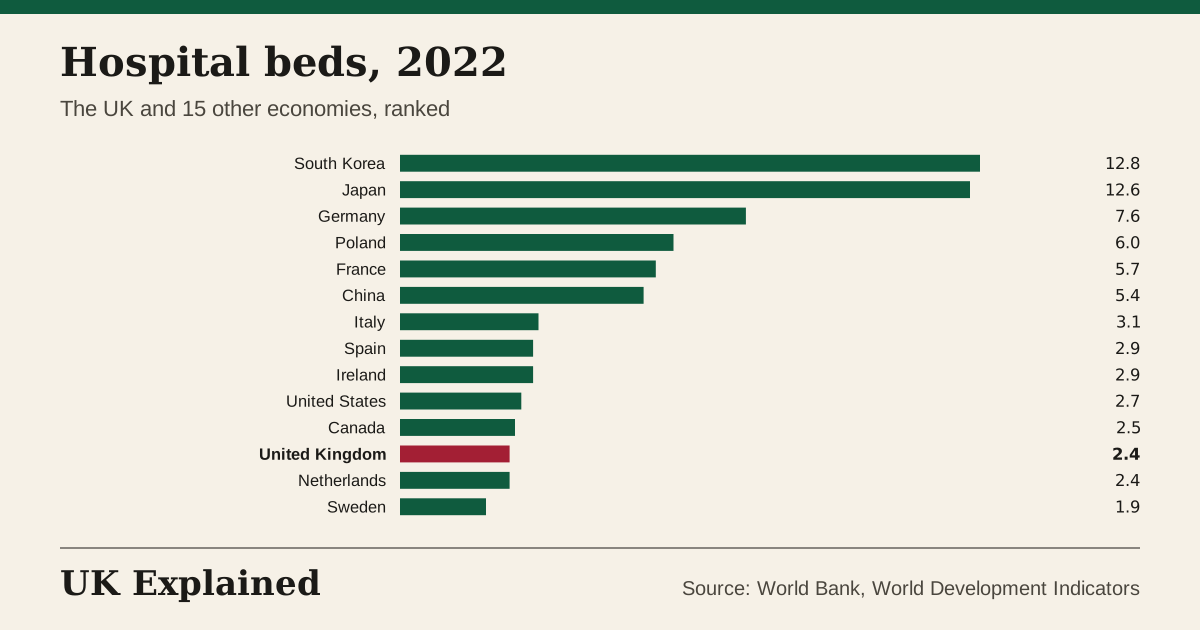
What it cannot tell you: Beds are not the same as staff or care, and countries organise care in hospitals and at home differently.
Life expectancy at birth, 2024: UK 11th of 16
How long a baby born this year would live, on average, if death rates stayed as they are now. years.
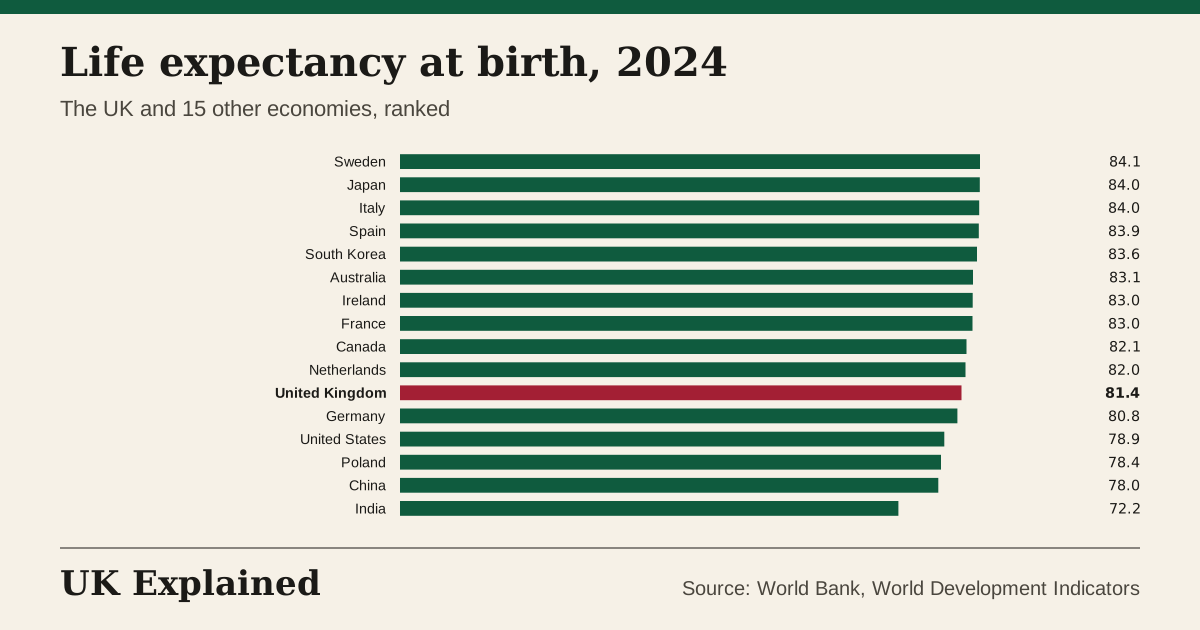
What it cannot tell you: It is an average across everyone, so it hides big gaps between richer and poorer places, and it is a forecast from today's death rates, not a promise.
Questions people ask
How does NHS spending compare with other countries?
11.0% of GDP in 2023 for all health spending, public and private; the middle of the other 15 is 9.8%.
Does the UK have enough doctors?
3.1 per 1,000 people in 2022; the middle of the other countries is 3.4. The count includes doctors in training but not their hours.
What does “uk: spending on health” measure?
All spending on health, public and private, as a share of everything the economy produces. It was 11.1% (% of GDP) in 2024, up 1.2 points on 2019. The highest we have is 12.1% (2020) and the lowest 7.1% (2000).
What does “uk: doctors” measure?
The number of doctors for every 1,000 people. It was 3.3 (per 1,000 people) in 2023, up 17% on 2018. The highest we have is 3.3 (2023) and the lowest 1.6 (1990).
What does “uk: hospital beds” measure?
The number of hospital beds for every 1,000 people. It was 2.4 (per 1,000 people) in 2022, down 4% on 2017. The highest we have is 5.9 (1990) and the lowest 2.4 (2021).
Sources: World Bank, World Development Indicators and the World Bank. Updated every night. Each chart has a CSV and a Share button.
See also: Health · The waiting list · Life expectancy