How long do people in the UK live, and how many children do they have?
A baby born in the UK in 2024 could expect to live 81.4 years, 11th highest of the 16 economies we compare. Women in the UK have 1.55 children on average (2024), below the 2.1 needed to keep the population steady without migration.
Years, 2024. about the same on 2014.
2024. down 14% on 2014.
Of the population, 2025. up 1.9 points on 2015.
Over time
What’s this?
How long a baby born this year would live, on average, if death rates stayed as they are now.
What it cannot tell you: It is an average across everyone, so it hides big gaps between richer and poorer places, and it is a forecast from today's death rates, not a promise.
What’s this?
The average number of children a woman would have in her lifetime at current birth rates (the total fertility rate).
What it cannot tell you: It is a snapshot of one year's birth rates, so it moves when women delay or bring forward having children.
What’s this?
The share of the population who are 65 or older.
What it cannot tell you: It says nothing about health or independence in later life, or about how many younger people are available to work.
What’s this?
Babies who die before their first birthday, for every 1,000 born alive.
What it cannot tell you: Rates are small, so they move a little from year to year by chance.
Against other countries
Ranked, using the latest year the World Bank has for most of the 16 economies. The United Kingdom is picked out in the bar colour. Countries differ in size, climate and how they collect the figures, so a rank is a starting point, not a verdict.
Life expectancy at birth, 2024: UK 11th of 16
How long a baby born this year would live, on average, if death rates stayed as they are now. years.
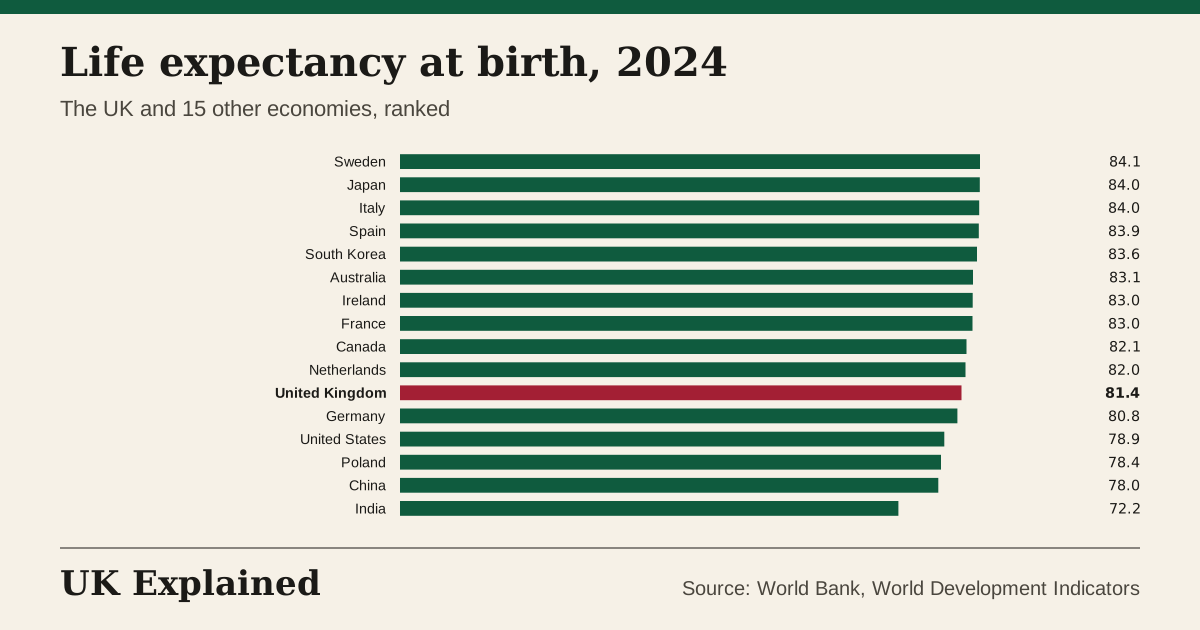
What it cannot tell you: It is an average across everyone, so it hides big gaps between richer and poorer places, and it is a forecast from today's death rates, not a promise.
Births per woman, 2024: UK 4th of 16
The average number of children a woman would have in her lifetime at current birth rates (the total fertility rate). children per woman.
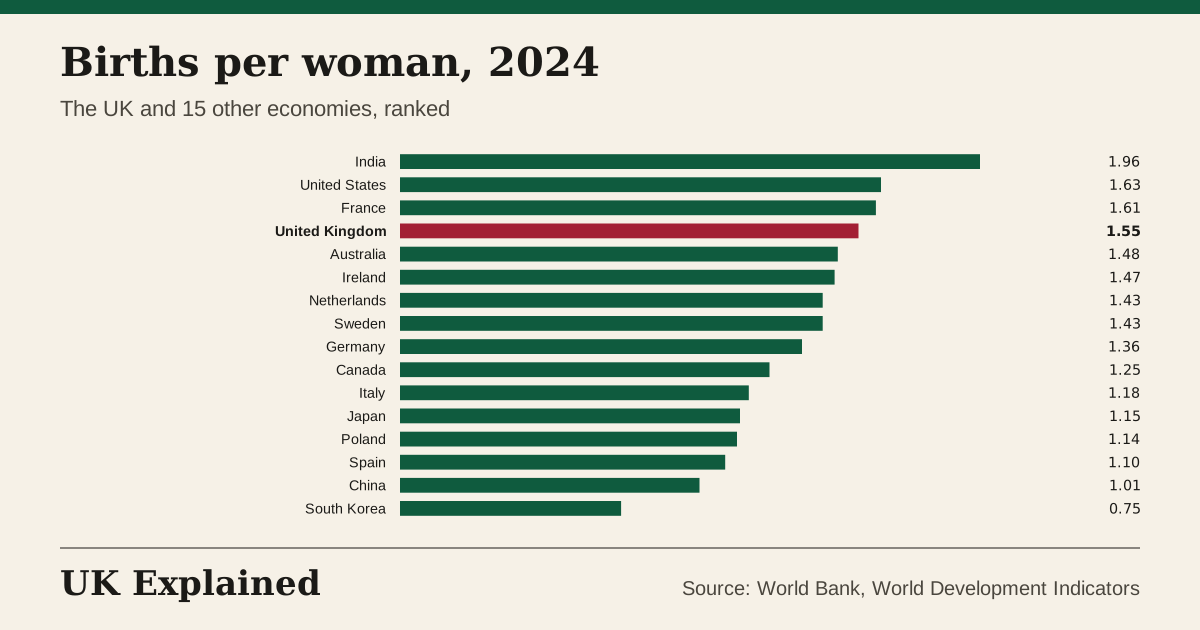
What it cannot tell you: It is a snapshot of one year's birth rates, so it moves when women delay or bring forward having children.
People aged 65 and over, 2025: UK 11th of 16
The share of the population who are 65 or older. % of population.
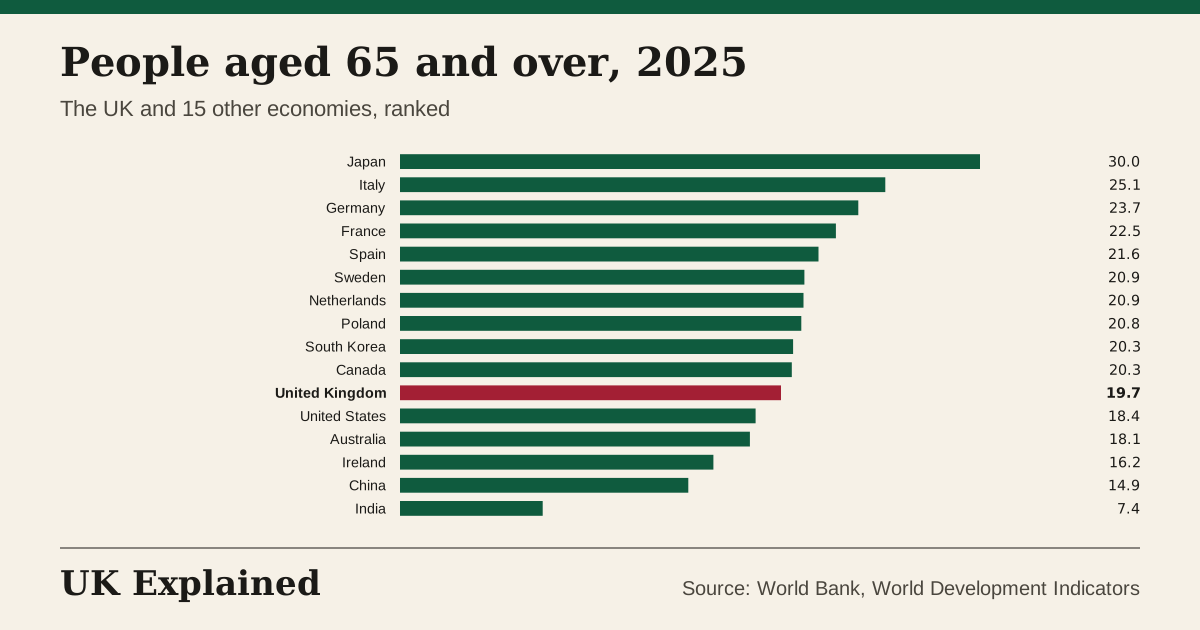
What it cannot tell you: It says nothing about health or independence in later life, or about how many younger people are available to work.
Infant deaths, 2024: UK 4th of 16
Babies who die before their first birthday, for every 1,000 born alive. deaths per 1,000 births.
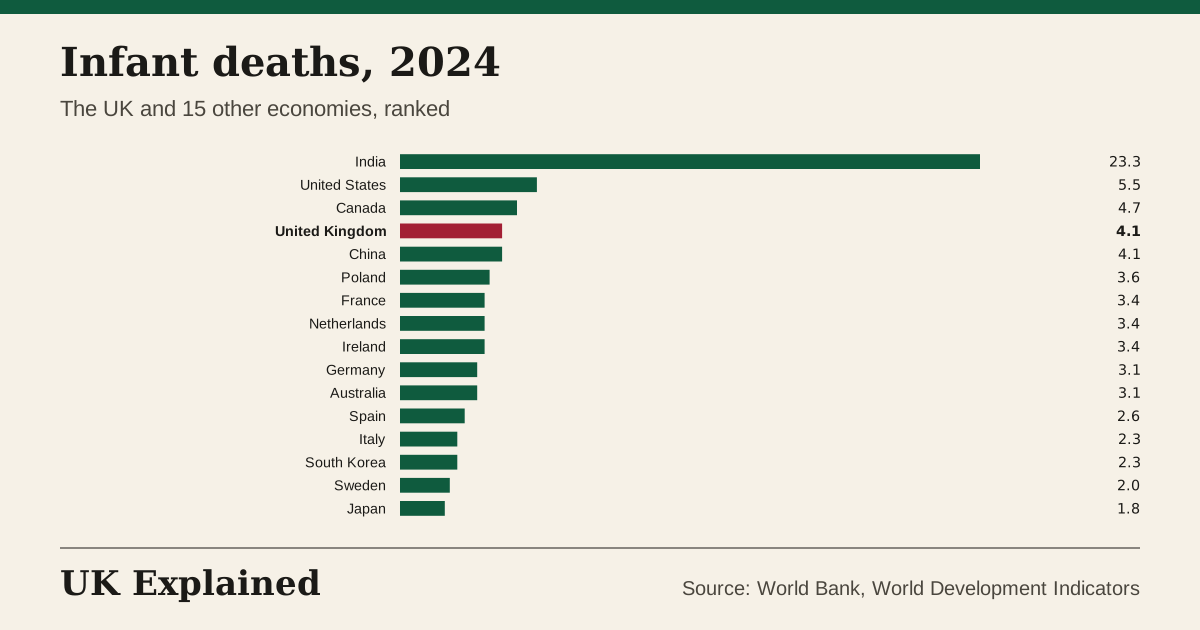
What it cannot tell you: Rates are small, so they move a little from year to year by chance.
Questions people ask
What is the average life expectancy in the UK?
81.4 years at birth in 2024, for men and women together (World Bank). The middle of the other 15 economies is 83.0, and the highest is Sweden at 84.1.
What is the UK birth rate?
Women in the UK had 1.55 children on average in 2024. A rate of about 2.1 is needed for a population to replace itself without migration.
Is the UK population ageing?
19.7% of people were 65 or over in 2025, up 1.9 points on 2015.
What does “uk: life expectancy at birth” measure?
How long a baby born this year would live, on average, if death rates stayed as they are now. It was 81.4 (years) in 2024, about the same on 2019. The highest we have is 81.4 (2024) and the lowest 75.9 (1990).
What does “uk: births per woman” measure?
The average number of children a woman would have in her lifetime at current birth rates (the total fertility rate). It was 1.55 (children per woman) in 2024, down 5% on 2019. The highest we have is 1.92 (2010) and the lowest 1.55 (2024).
What does “uk: people aged 65 and over” measure?
The share of the population who are 65 or older. It was 19.7% (% of population) in 2025, up 1.1 points on 2020. The highest we have is 19.7% (2025) and the lowest 15.9% (1990).
What does “uk: infant deaths” measure?
Babies who die before their first birthday, for every 1,000 born alive. It was 4.1 (deaths per 1,000 births) in 2024, up 8% on 2019. The highest we have is 7.9 (1990) and the lowest 3.8 (2016).
Sources: World Bank, World Development Indicators and the World Bank. Updated every night. Each chart has a CSV and a Share button.
See also: Population over time