Download the data
Every dataset on UK Explained as a file you can open in a spreadsheet, rebuilt every night from the official figures.
Download everything One ZIP file, 262 datasets, 276 KB. Includes a list of every file.
Using the files. Free to reuse for any purpose, including commercial use, as long as you credit UK Explained (ukexplained.uk) and the original source named with each figure. Terms.
What is in each file. One row of column names, then the figures. Series over time have the columns period, value, unit and source; rankings of countries or regions add the name and the period they cover. The list of every file is catalogue.csv.
For developers. The same figures as JSON: the data feed. For journalists. How to cite us: press kit.
Government money
(4)
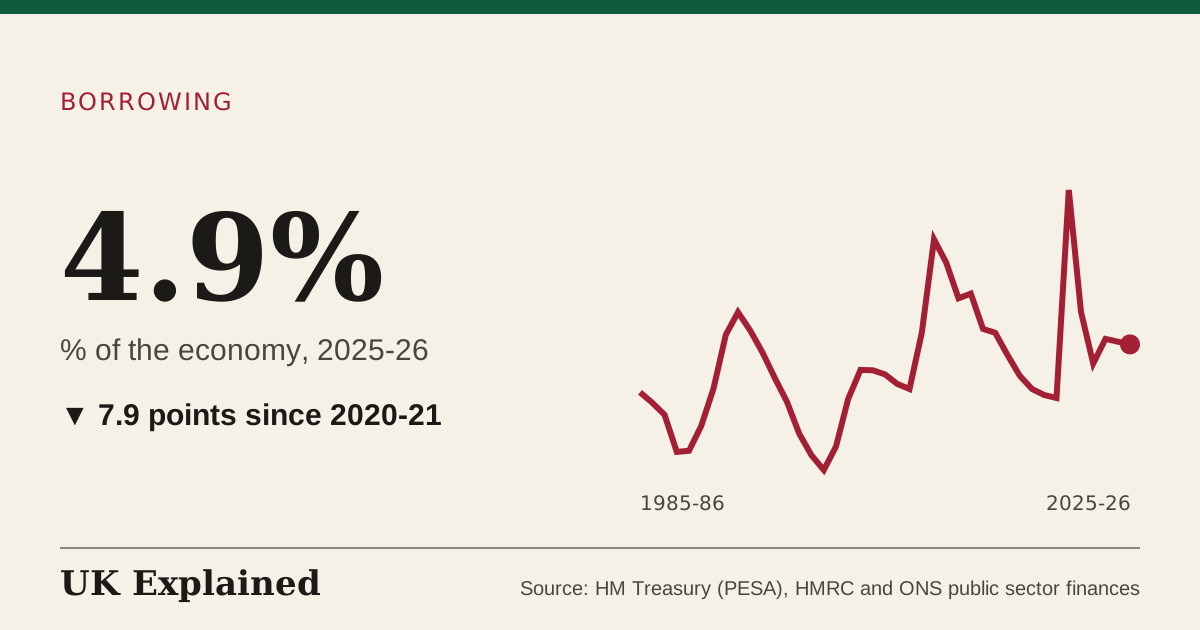
- % of the economy · 1985–86 to 2025–26 · Source: HM Treasury (PESA), HMRC and ONS public sector finances · Updated 7 November 2026
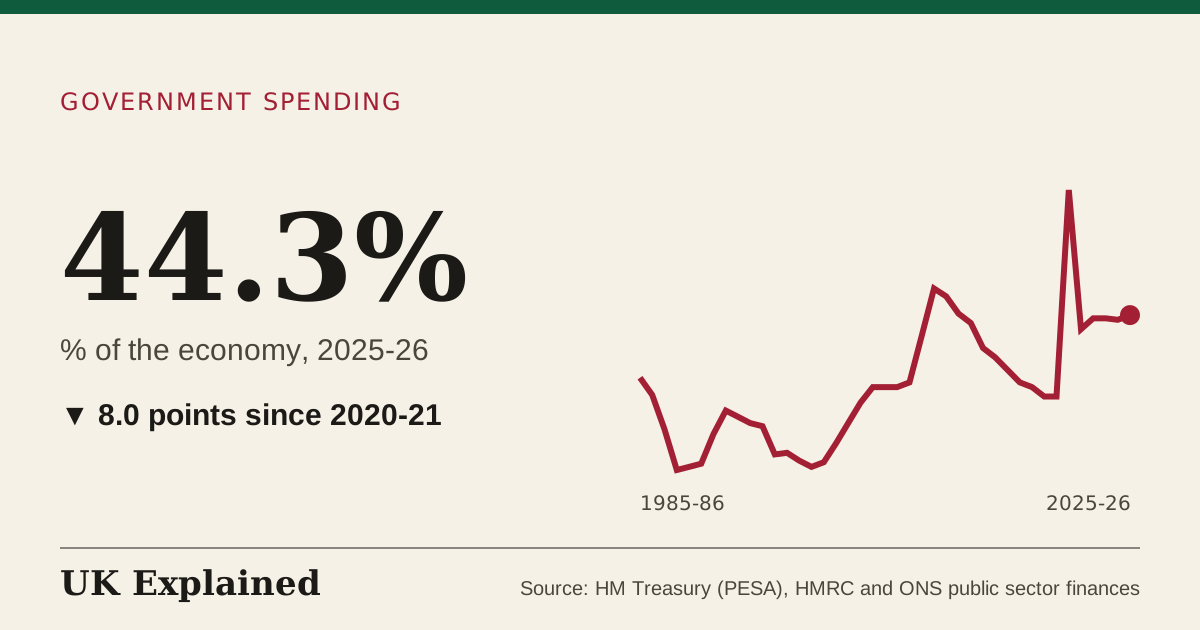
- % of the economy · 1985–86 to 2025–26 · Source: HM Treasury (PESA), HMRC and ONS public sector finances · Updated 7 November 2026
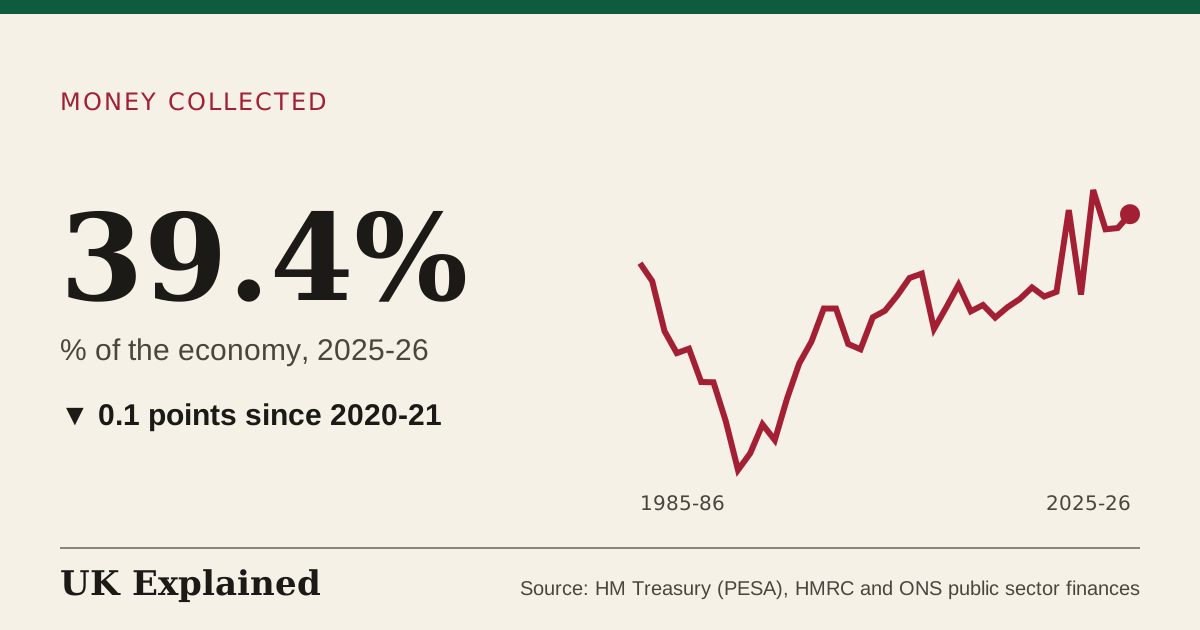
- % of the economy · 1985–86 to 2025–26 · Source: HM Treasury (PESA), HMRC and ONS public sector finances · Updated 7 November 2026
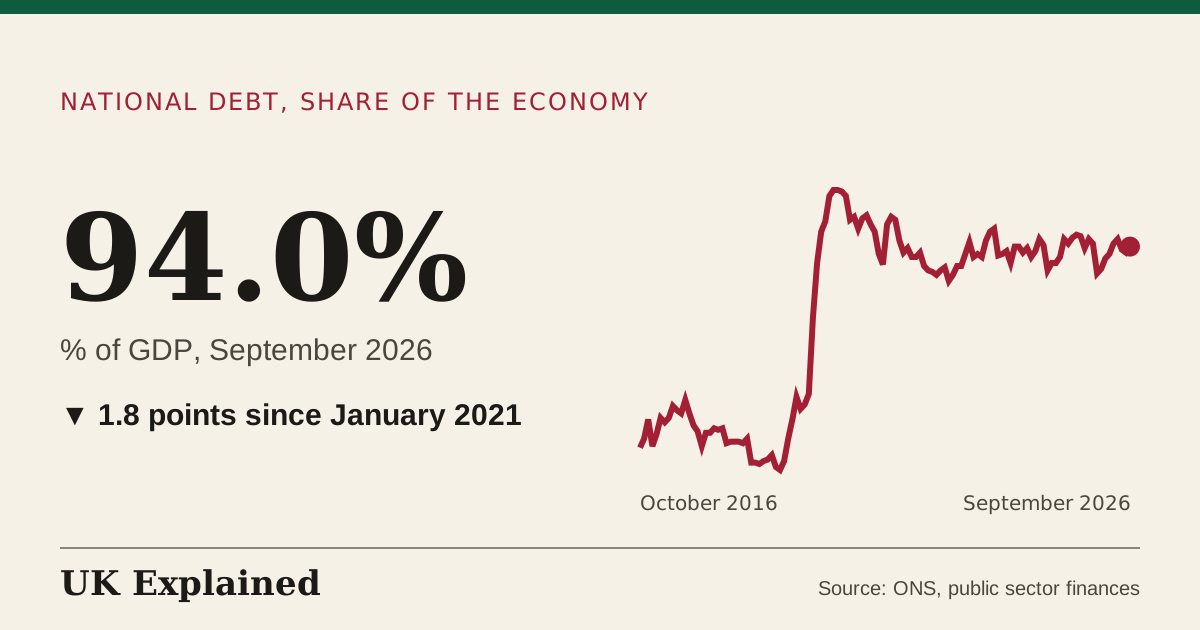
- % of GDP · March 1993 to September 2026 · Source: ONS, public sector finances · Updated 7 November 2026
Prices, pay and benefits claimants
(4)
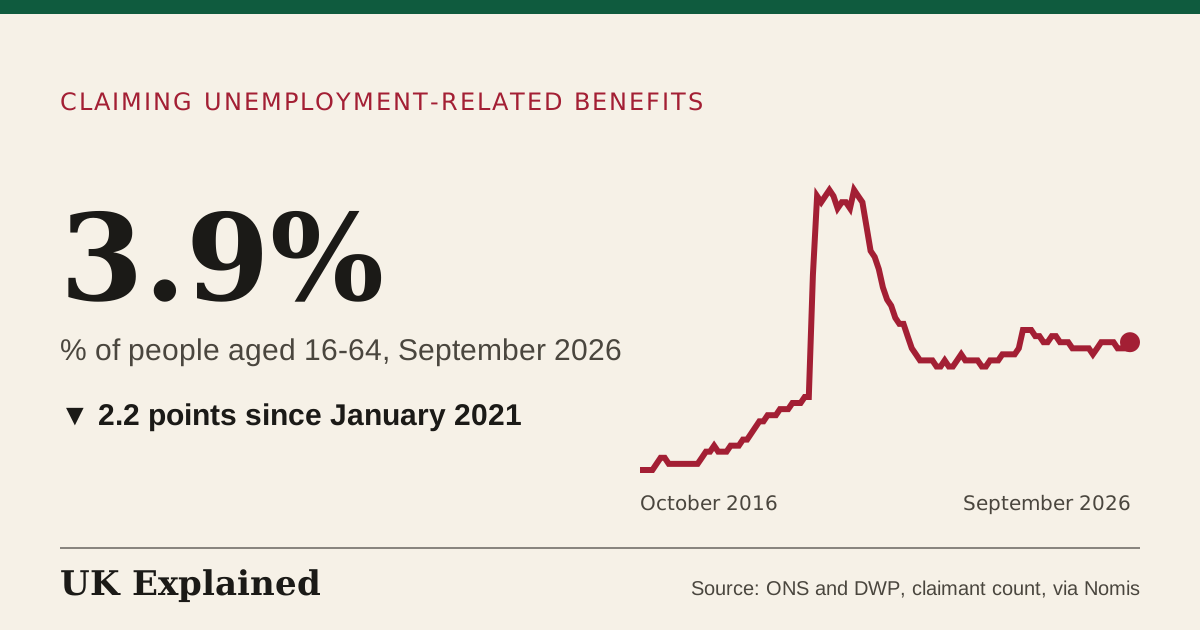
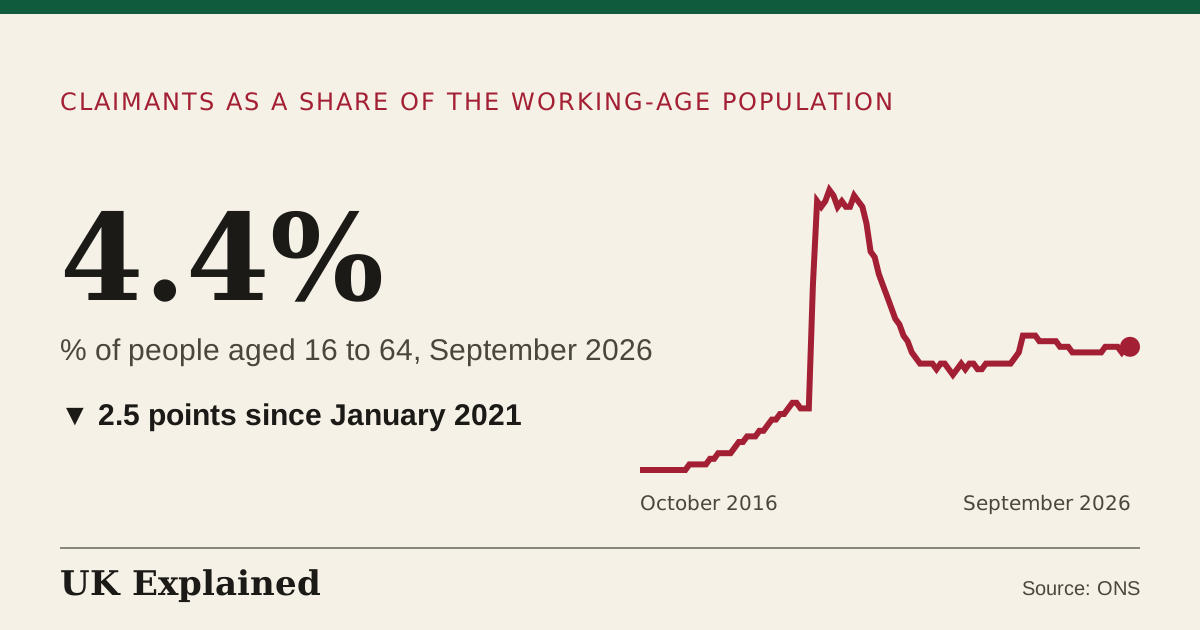
- % of people aged 16-64 · January 1996 to September 2026 · Source: ONS and DWP, claimant count, via Nomis · Updated 7 November 2026
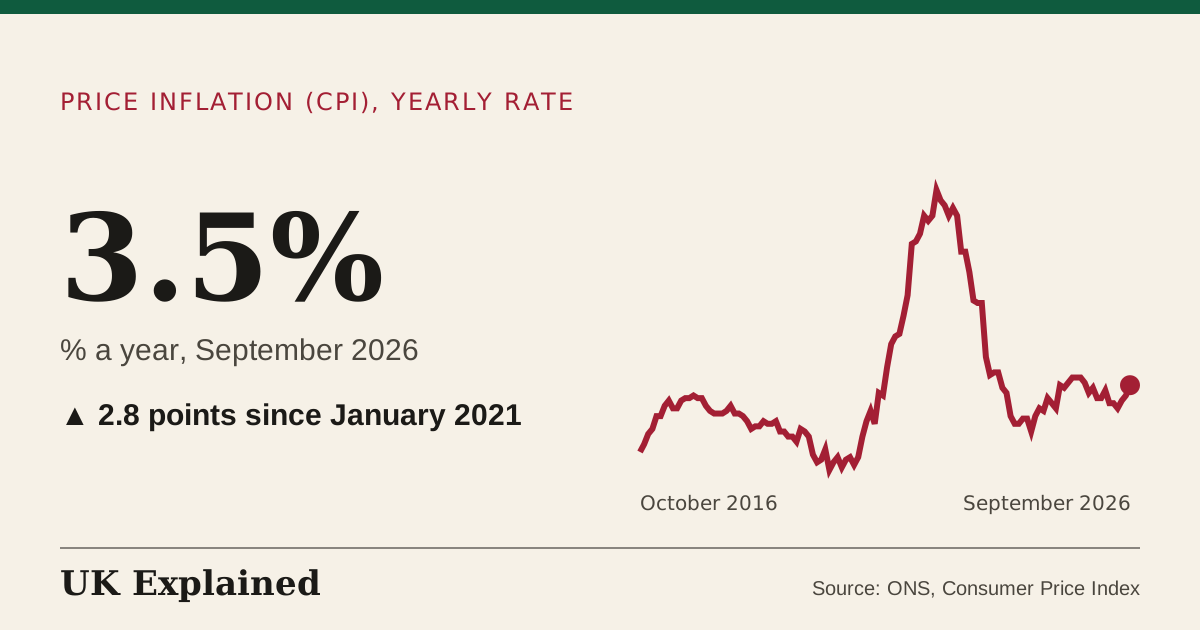
- % a year · January 1989 to September 2026 · Source: ONS, Consumer Price Index · Updated 7 November 2026
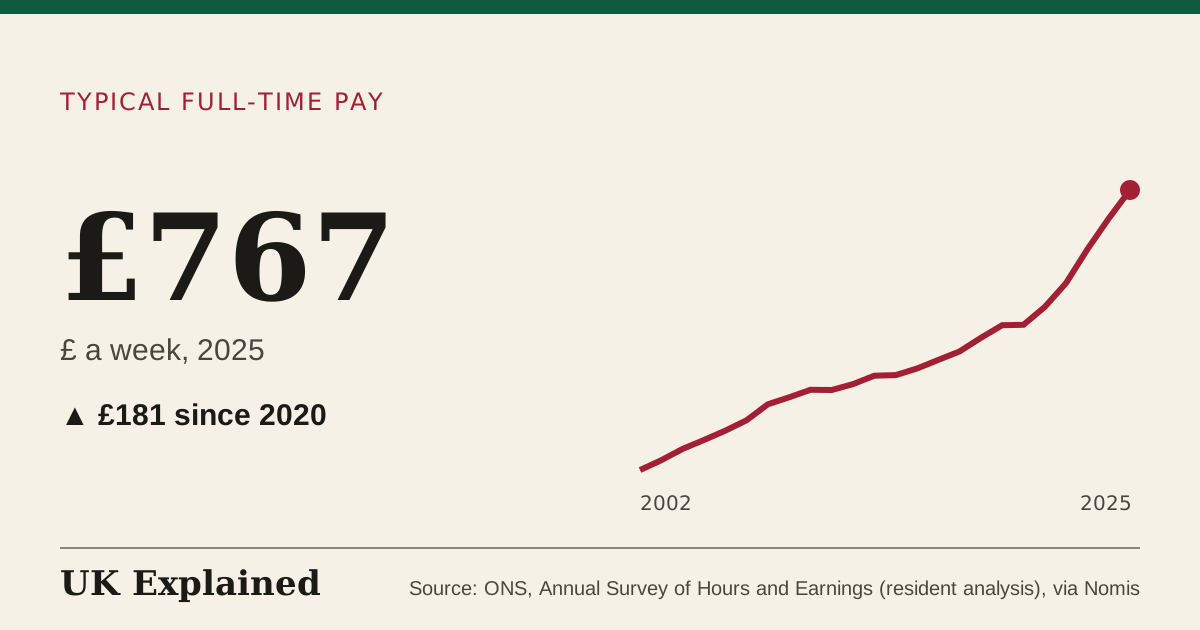
- £ a week · 2002 to 2025 · Source: ONS, Annual Survey of Hours and Earnings (resident analysis), via Nomis · Updated 7 November 2026
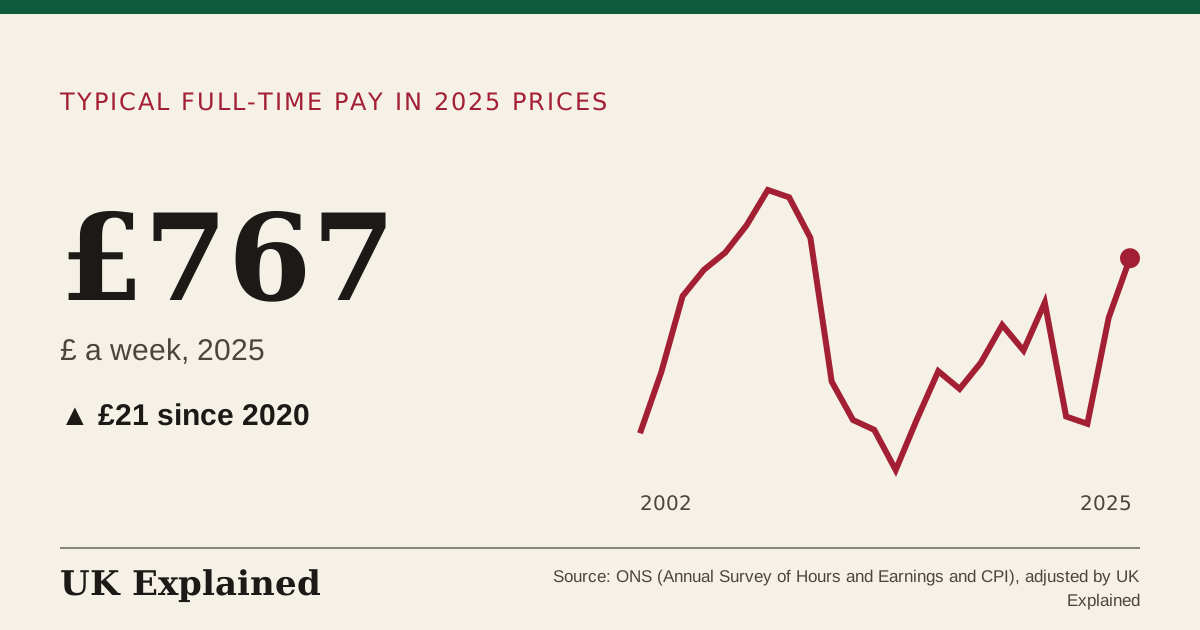
- £ a week · 2002 to 2025 · Source: ONS (Annual Survey of Hours and Earnings and CPI), adjusted by UK Explained · Updated 7 November 2026
The economy and jobs
(40)
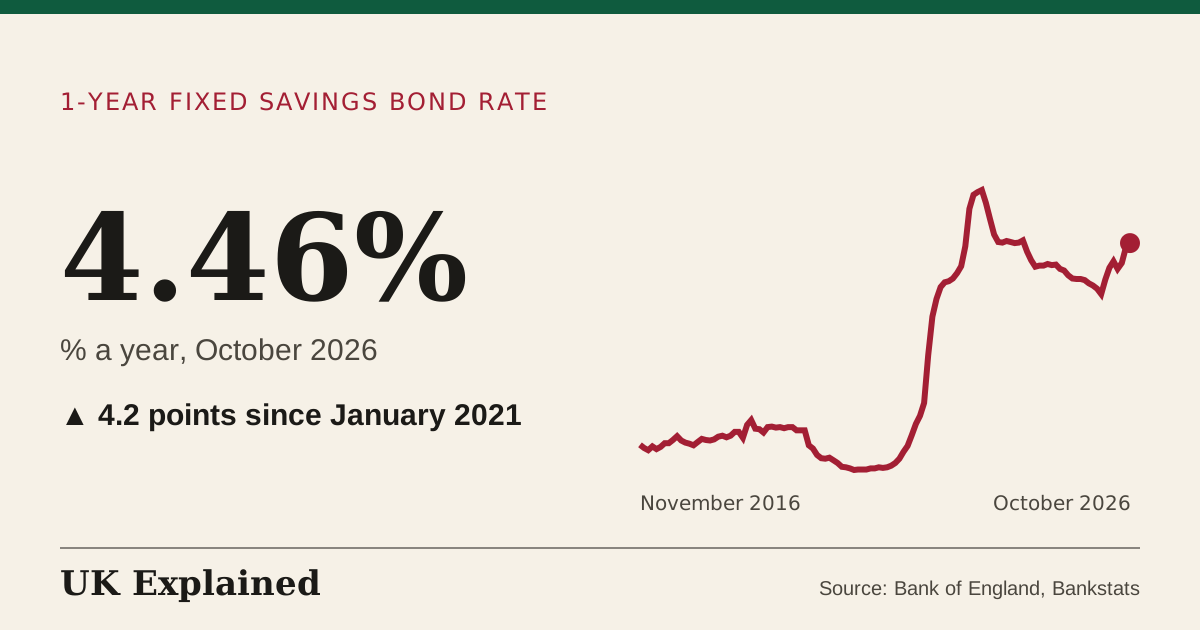
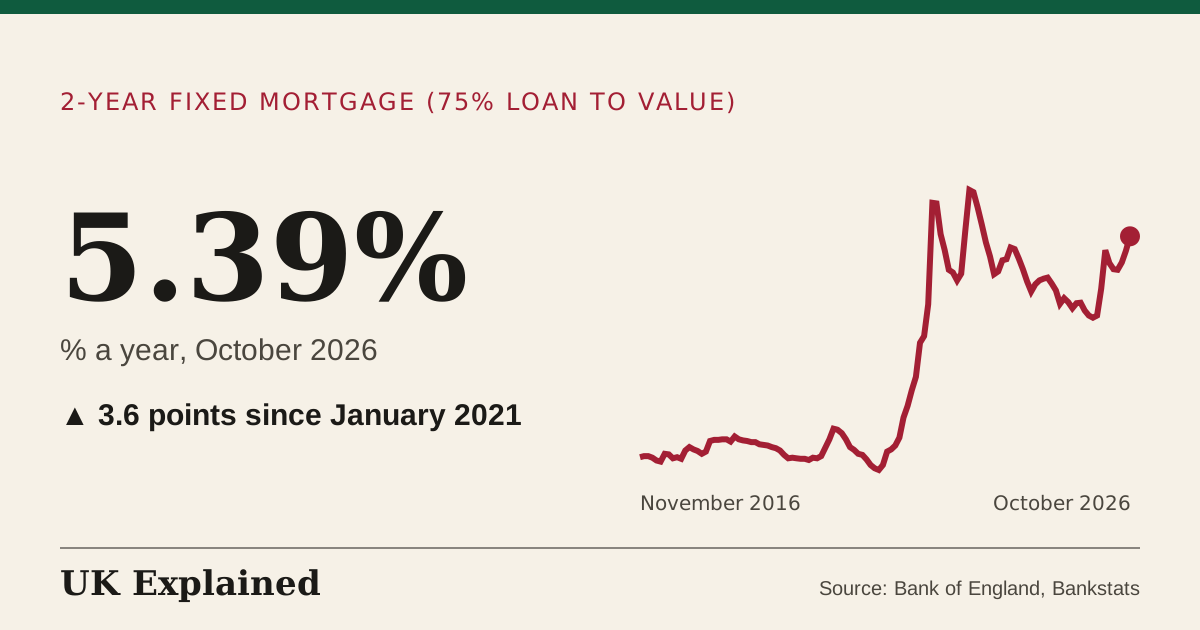
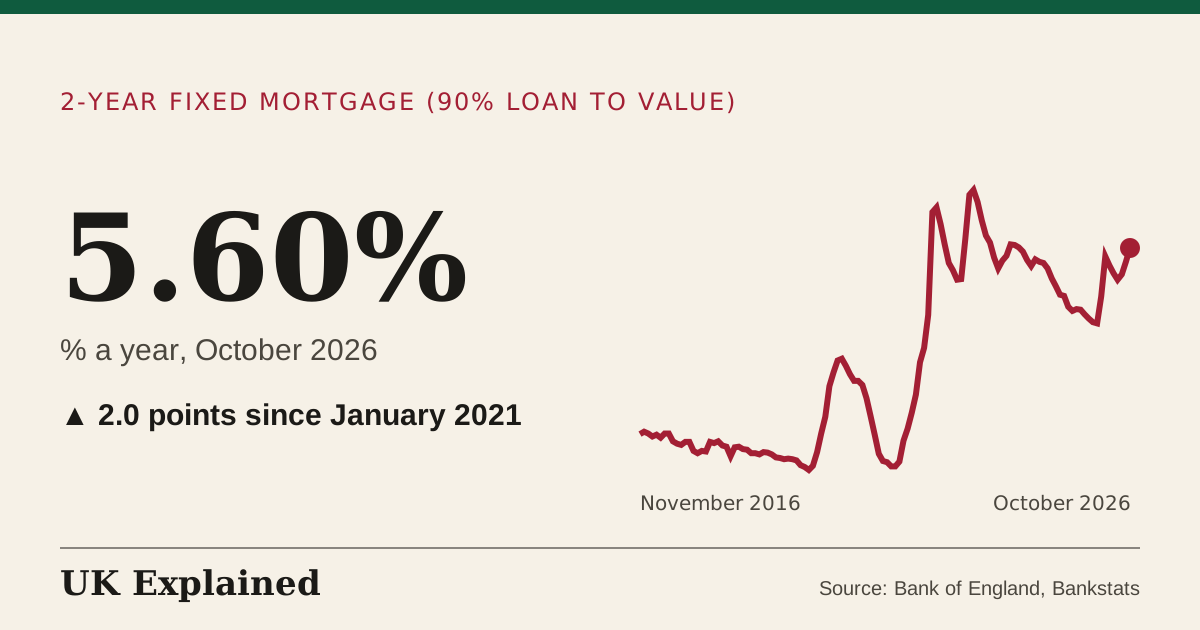
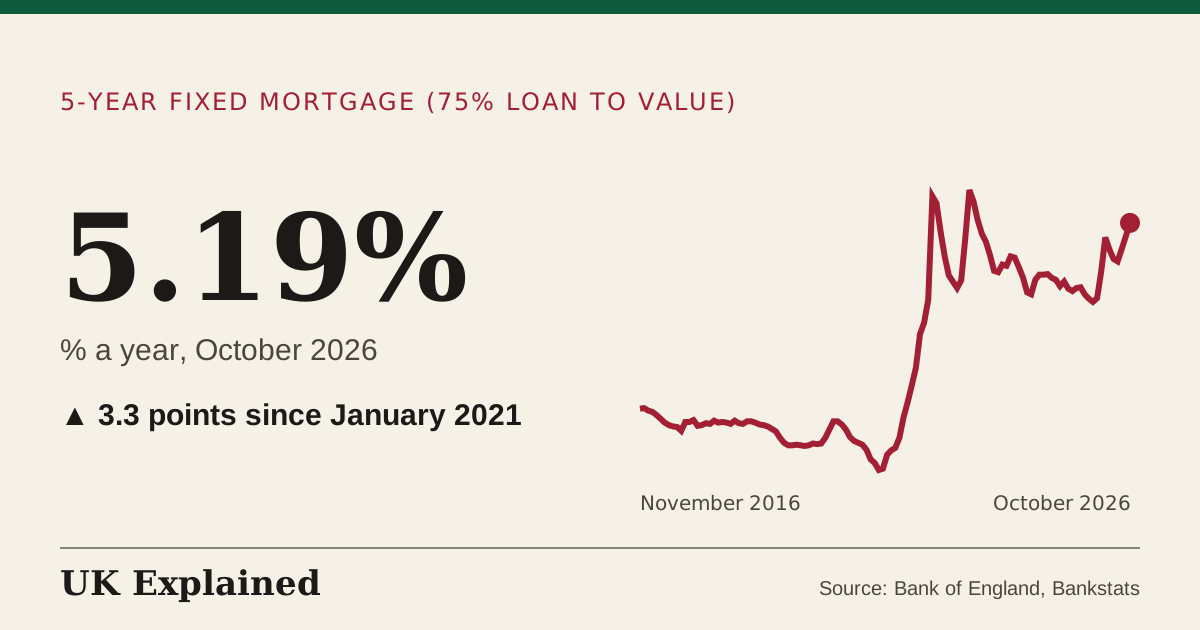
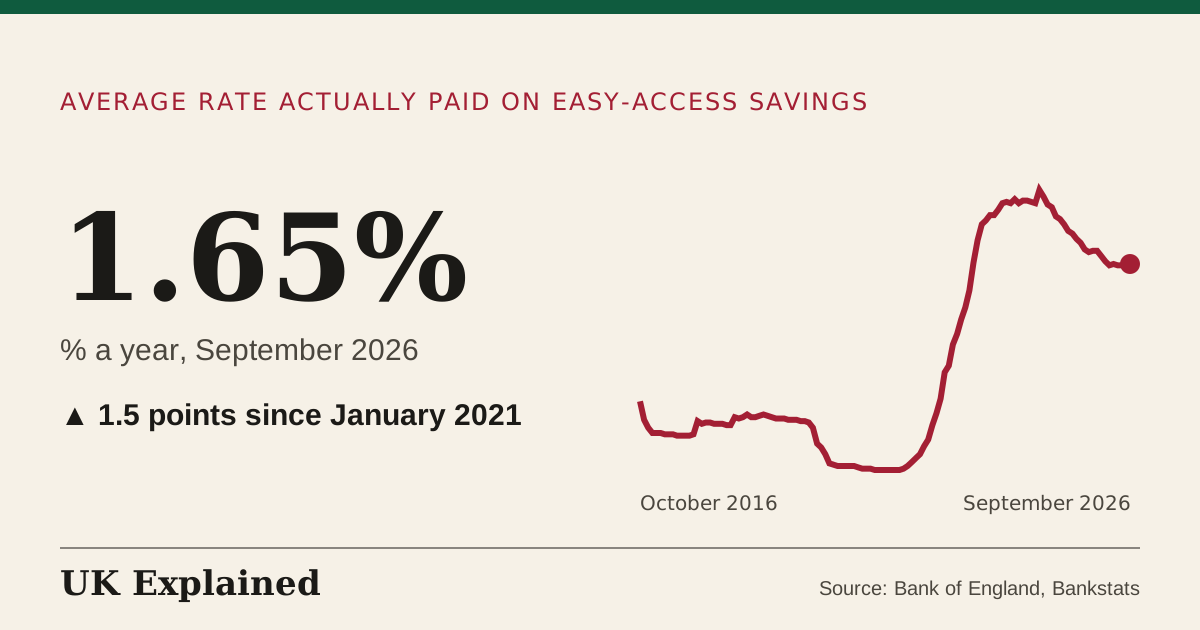
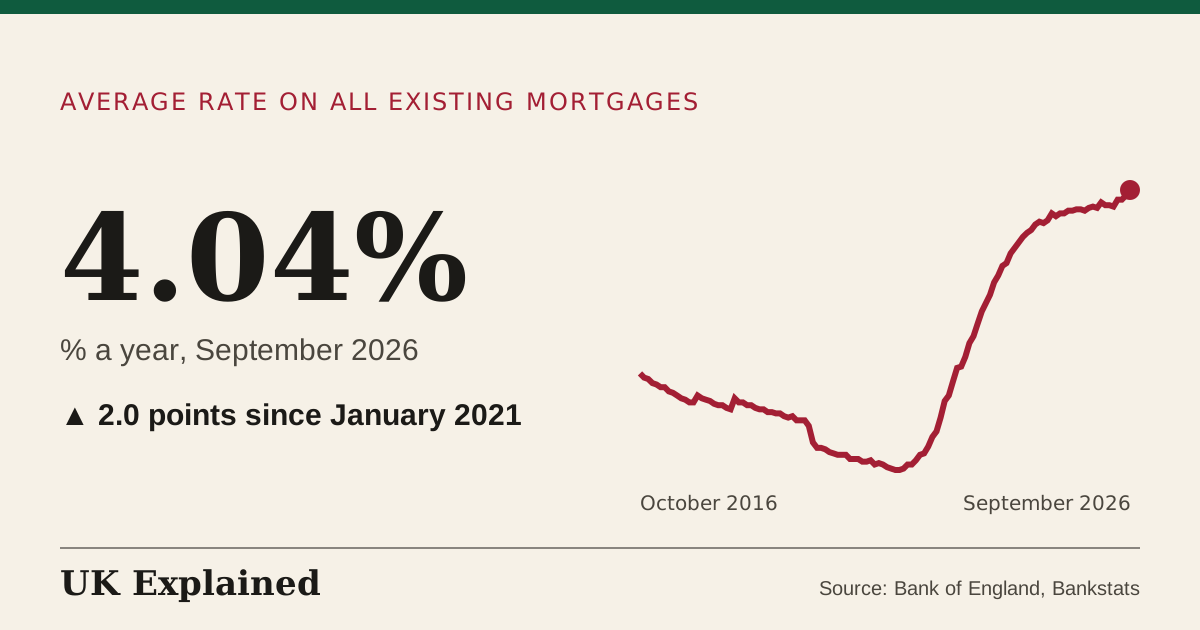
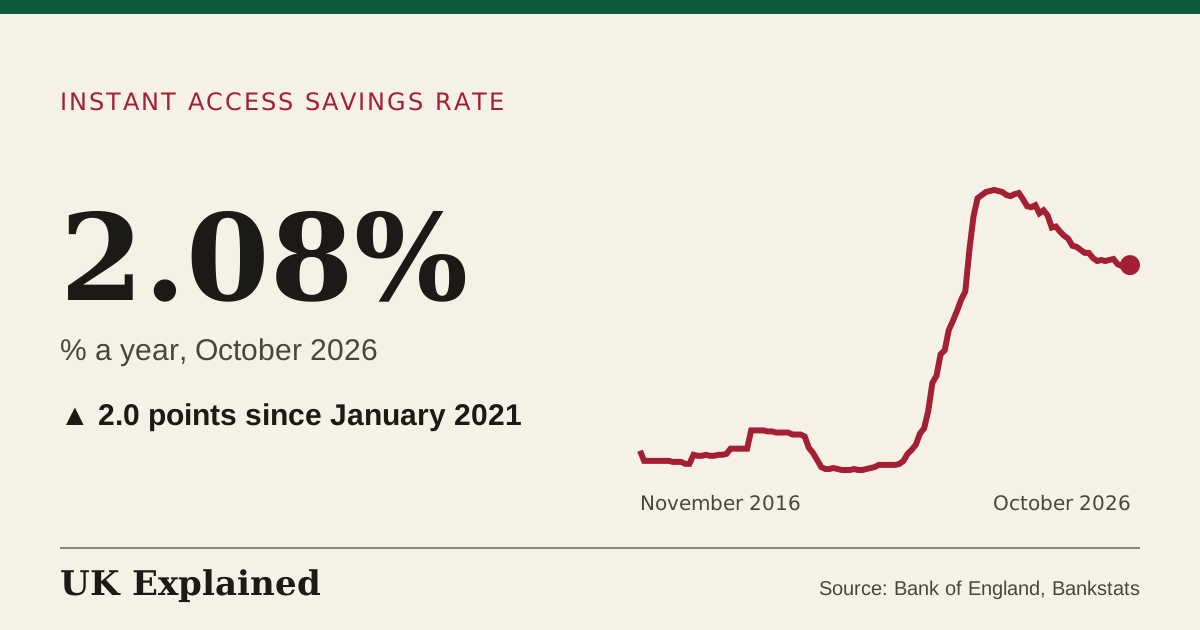
- % a year · January 1996 to October 2026 · Source: Bank of England, Bankstats · Updated 12 November 2026
- % a year · January 1995 to October 2026 · Source: Bank of England, Bankstats · Updated 12 November 2026
- % a year · May 2008 to October 2026 · Source: Bank of England, Bankstats · Updated 12 November 2026
- % a year · January 1995 to October 2026 · Source: Bank of England, Bankstats · Updated 12 November 2026
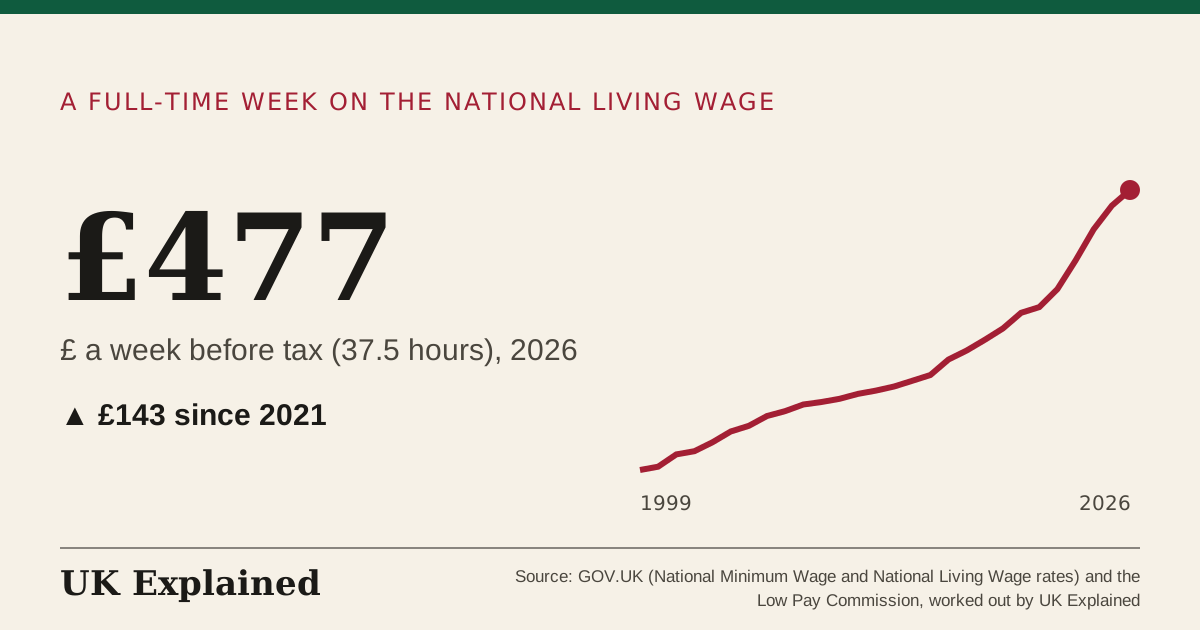
- £ a week before tax (37.5 hours) · 1999 to 2026 · Source: GOV.UK (National Minimum Wage and National Living Wage rates) and the Low Pay Commission, worked out by UK Explained · Updated 12 November 2026
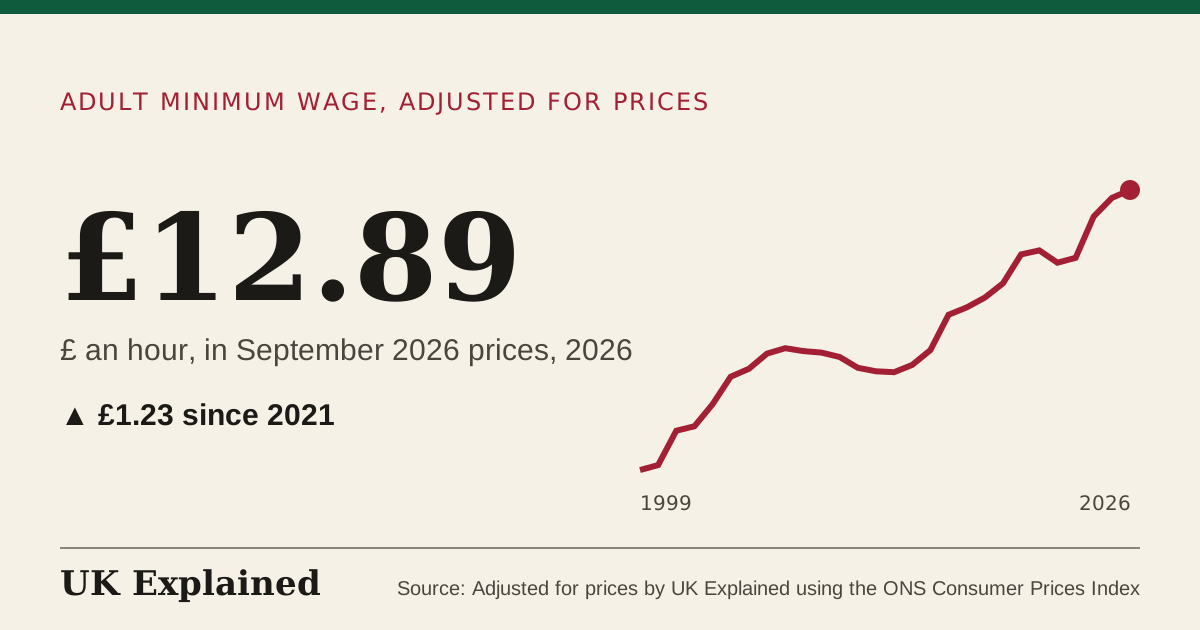
- £ an hour, in September 2026 prices · 1999 to 2026 · Source: Adjusted for prices by UK Explained using the ONS Consumer Prices Index · Updated 12 November 2026
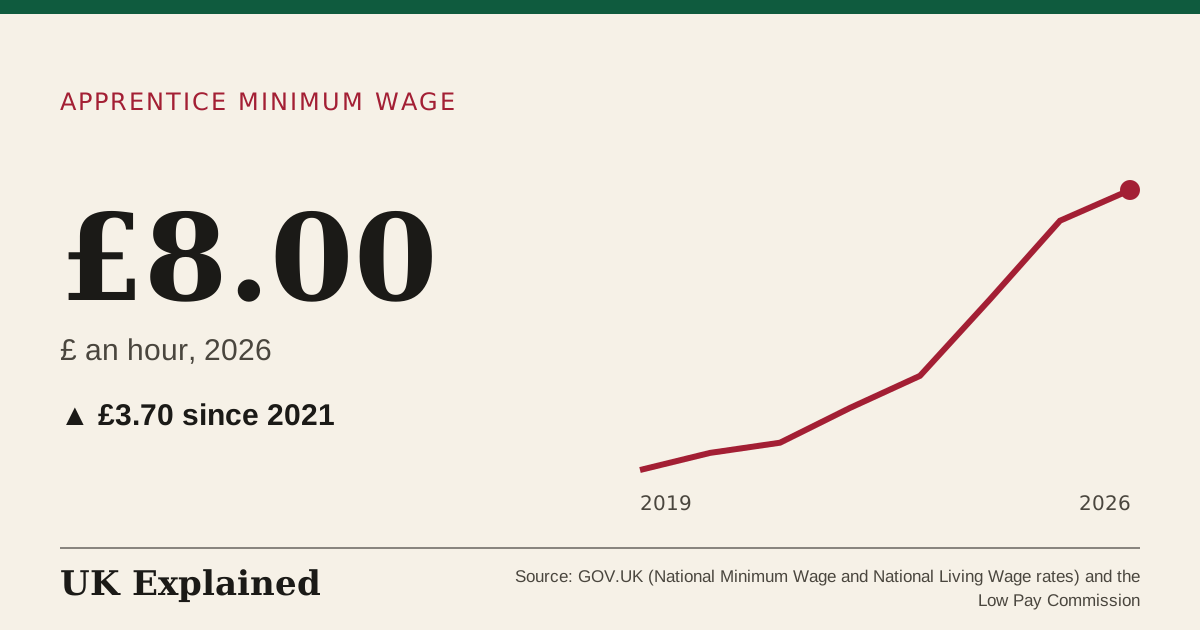
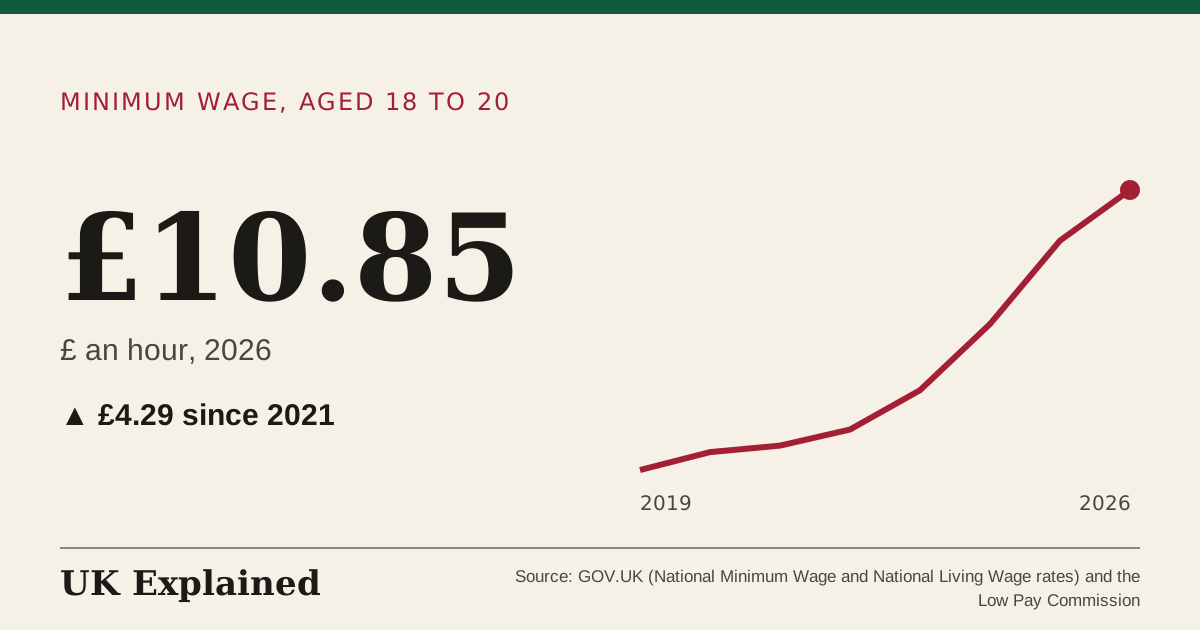
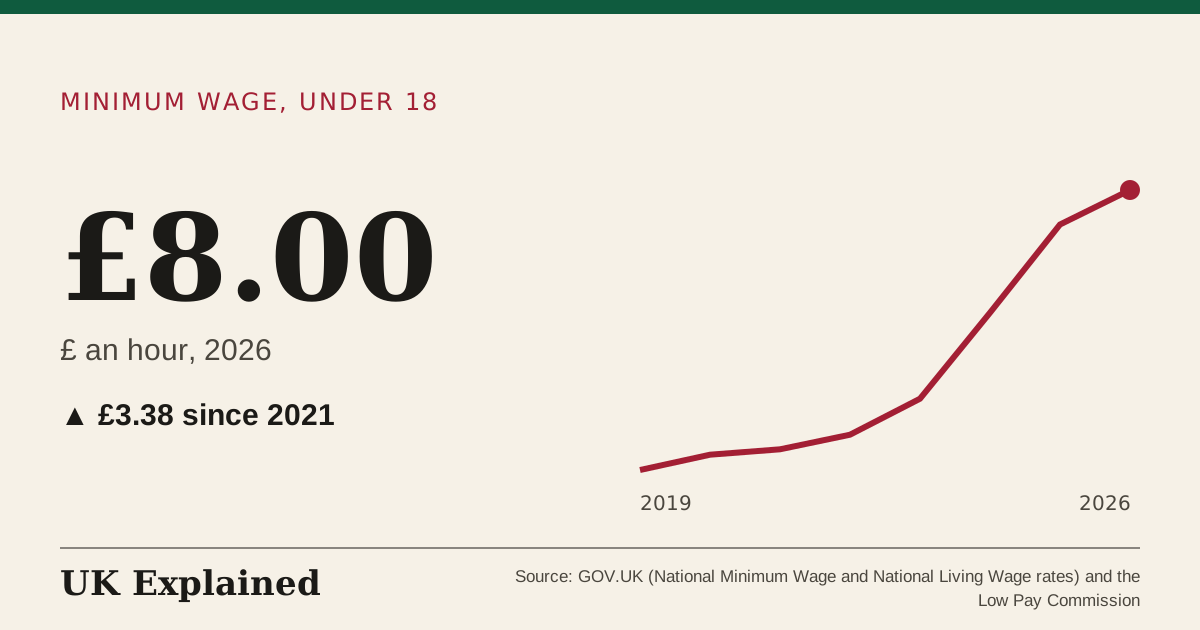
- £ an hour · 2019 to 2026 · Source: GOV.UK (National Minimum Wage and National Living Wage rates) and the Low Pay Commission · Updated 12 November 2026
- % a year · January 1999 to September 2026 · Source: Bank of England, Bankstats · Updated 12 November 2026
- % a year · January 1999 to September 2026 · Source: Bank of England, Bankstats · Updated 12 November 2026
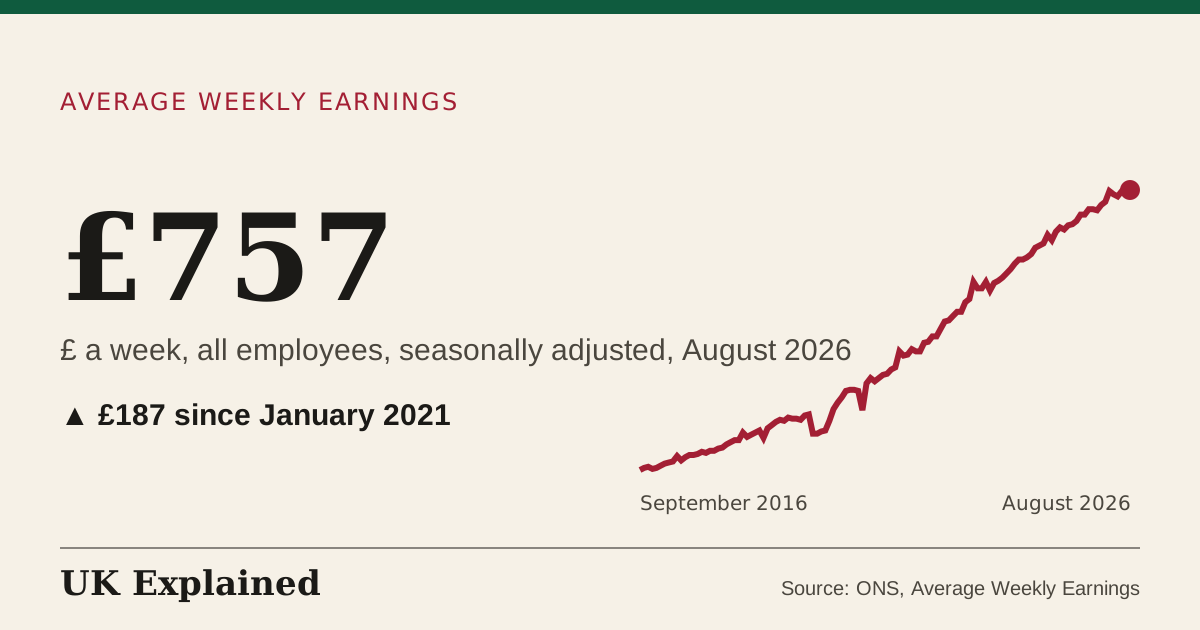
- £ a week, all employees, seasonally adjusted · January 2000 to August 2026 · Source: ONS, Average Weekly Earnings · Updated 7 November 2026
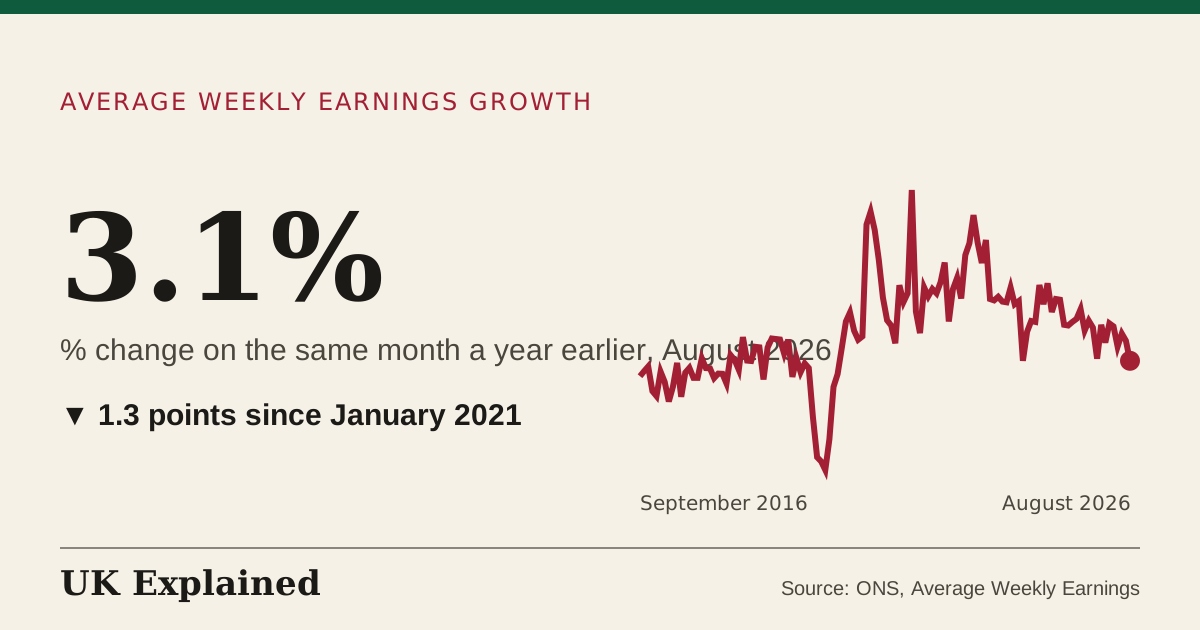
- % change on the same month a year earlier · January 2001 to August 2026 · Source: ONS, Average Weekly Earnings · Updated 7 November 2026
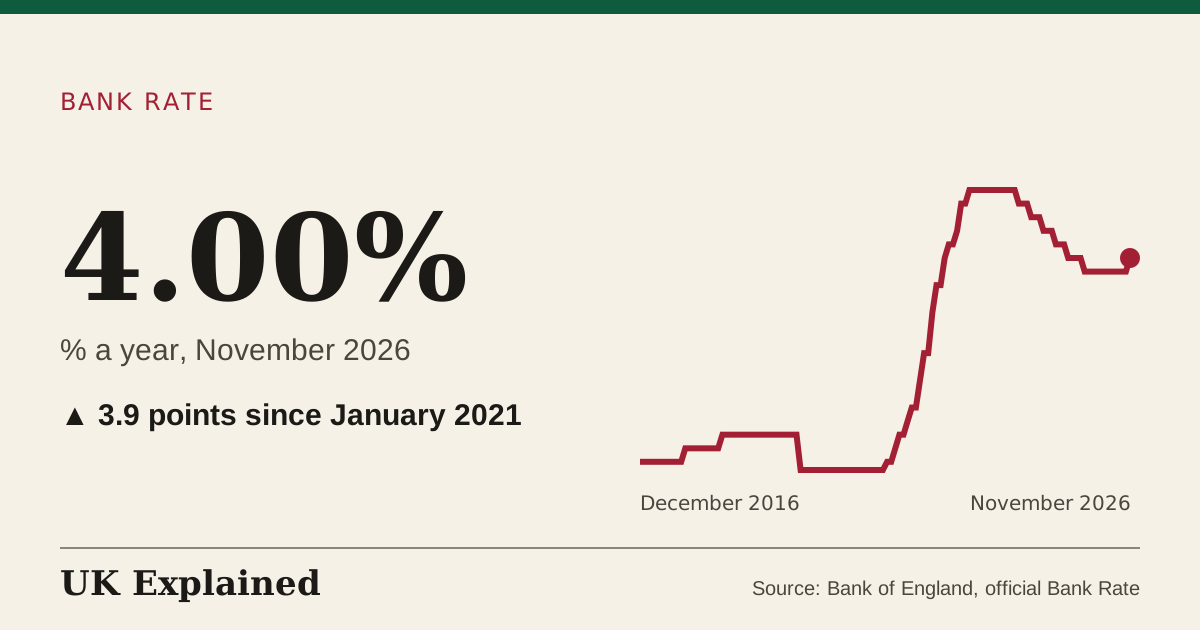
- % a year · January 1975 to November 2026 · Source: Bank of England, official Bank Rate · Updated 12 November 2026
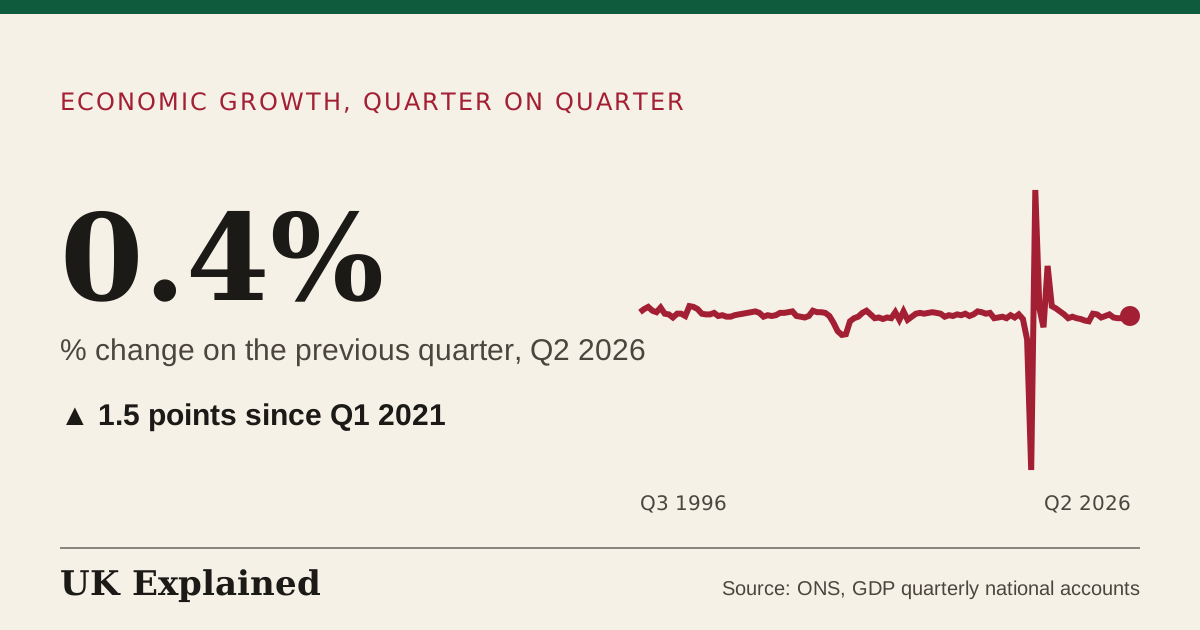
- % change on the previous quarter · Q2 1955 to Q2 2026 · Source: ONS, GDP quarterly national accounts · Updated 7 November 2026
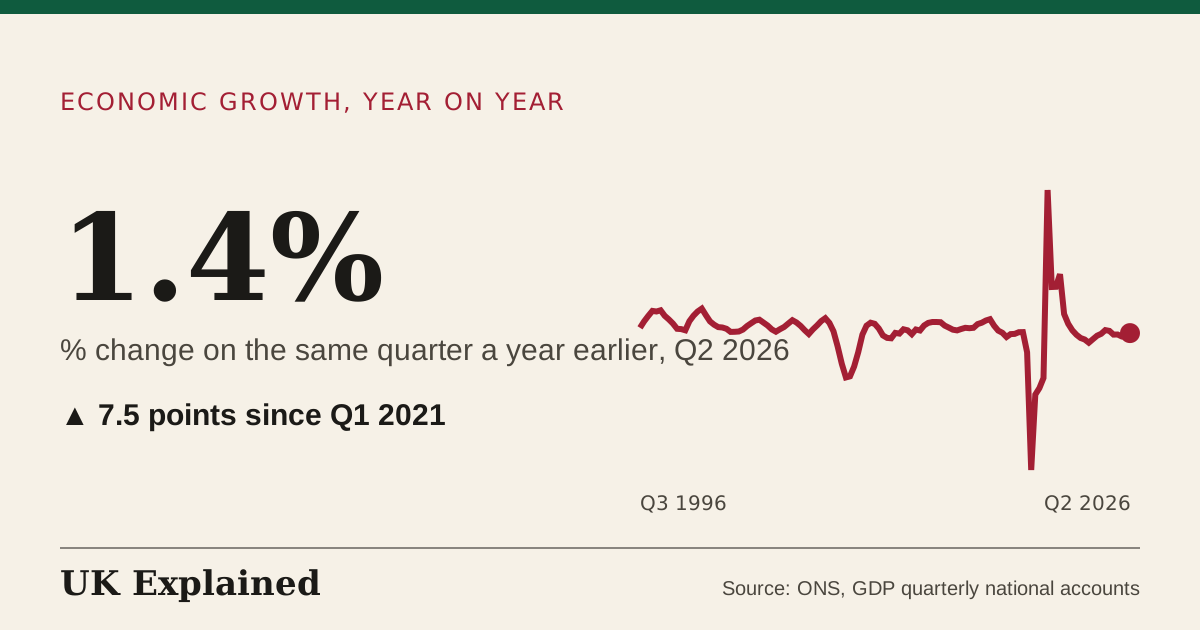
- % change on the same quarter a year earlier · Q1 1956 to Q2 2026 · Source: ONS, GDP quarterly national accounts · Updated 7 November 2026
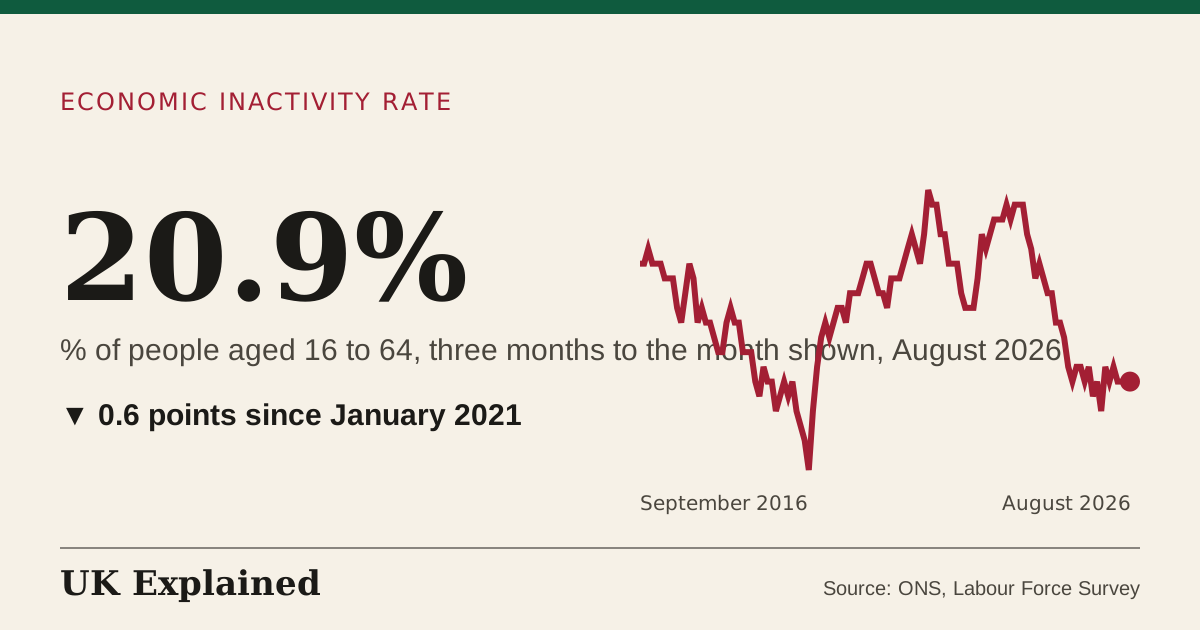
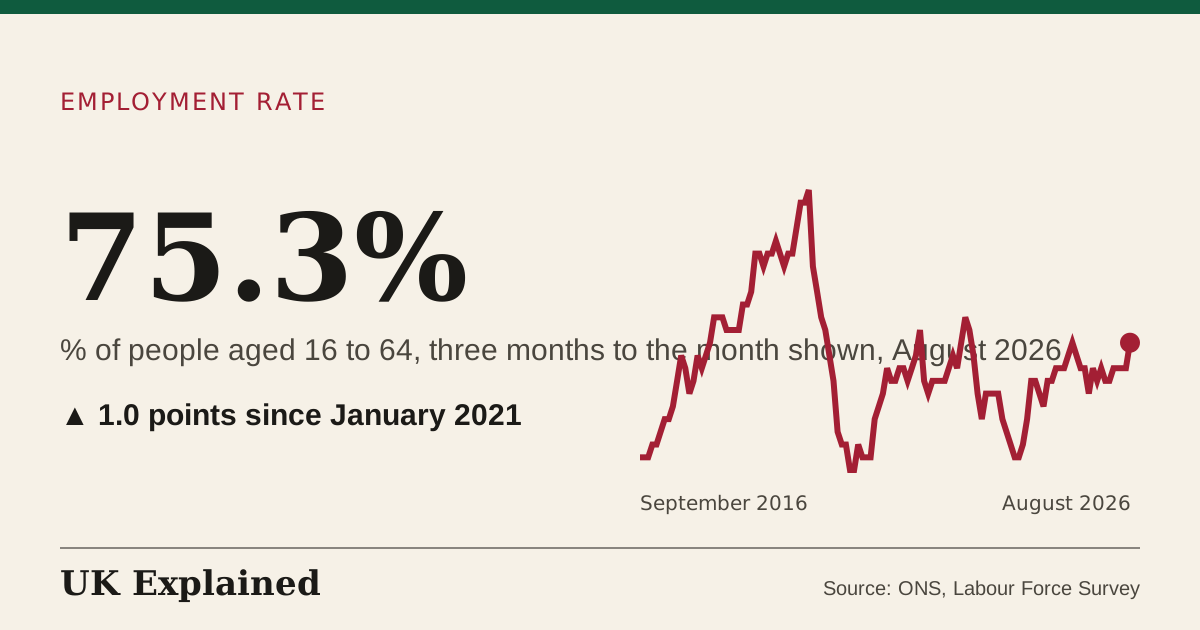
- % of people aged 16 to 64, three months to the month shown · March 1971 to August 2026 · Source: ONS, Labour Force Survey · Updated 7 November 2026
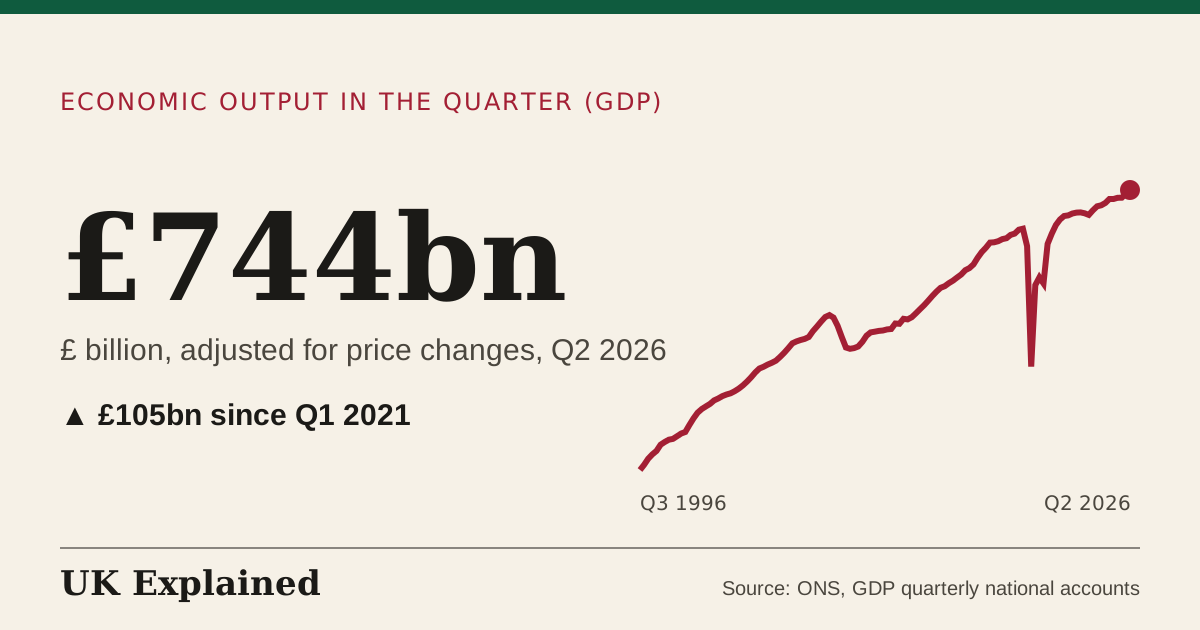
- £ billion, adjusted for price changes · Q1 1955 to Q2 2026 · Source: ONS, GDP quarterly national accounts · Updated 7 November 2026
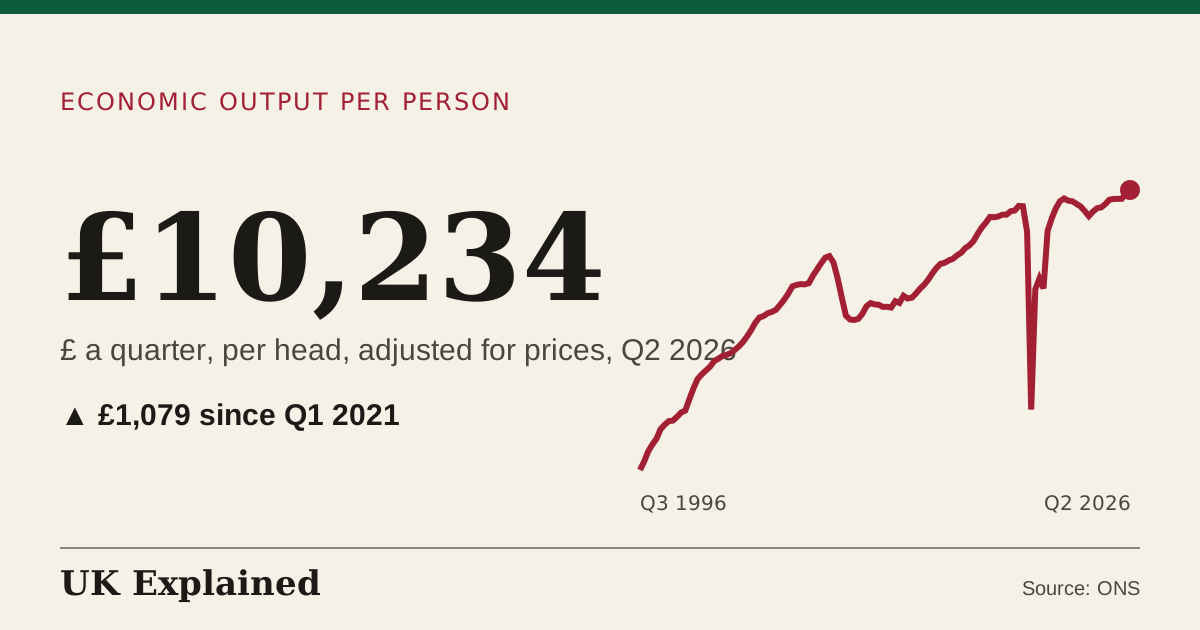
- £ a quarter, per head, adjusted for prices · Q1 1990 to Q2 2026 · Source: ONS · Updated 7 November 2026
- % of people aged 16 to 64, three months to the month shown · March 1971 to August 2026 · Source: ONS, Labour Force Survey · Updated 7 November 2026
- % a year · January 2011 to October 2026 · Source: Bank of England, Bankstats · Updated 12 November 2026
- £ an hour · 2019 to 2026 · Source: GOV.UK (National Minimum Wage and National Living Wage rates) and the Low Pay Commission · Updated 12 November 2026
- £ an hour · 2019 to 2026 · Source: GOV.UK (National Minimum Wage and National Living Wage rates) and the Low Pay Commission · Updated 12 November 2026
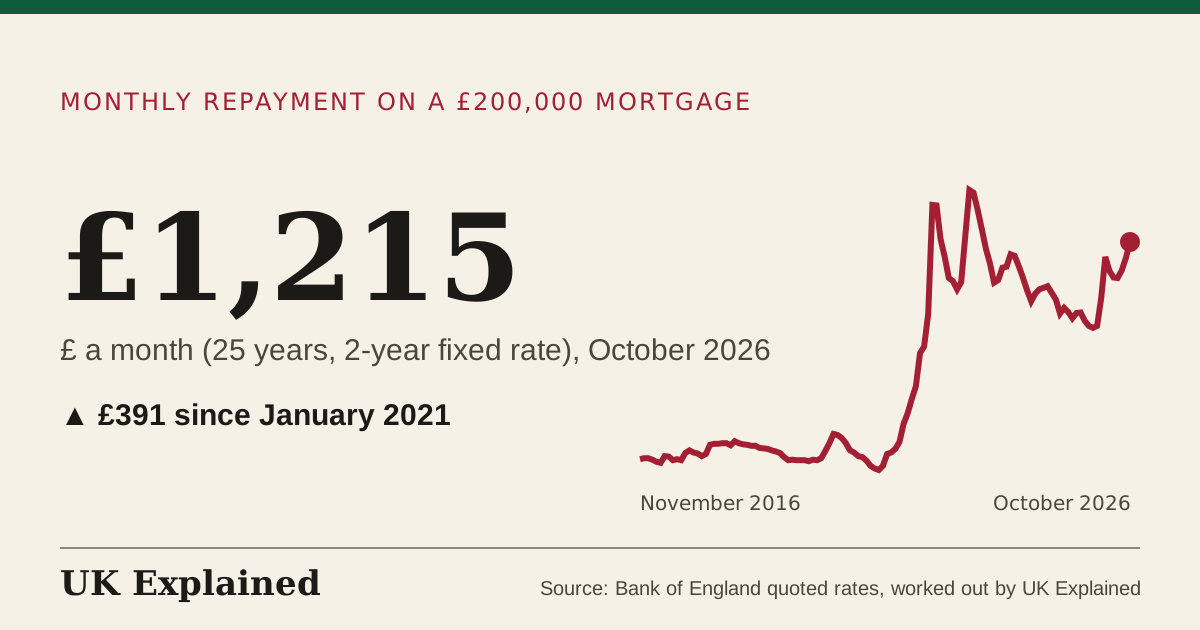
- £ a month (25 years, 2-year fixed rate) · January 1995 to October 2026 · Source: Bank of England quoted rates, worked out by UK Explained · Updated 12 November 2026
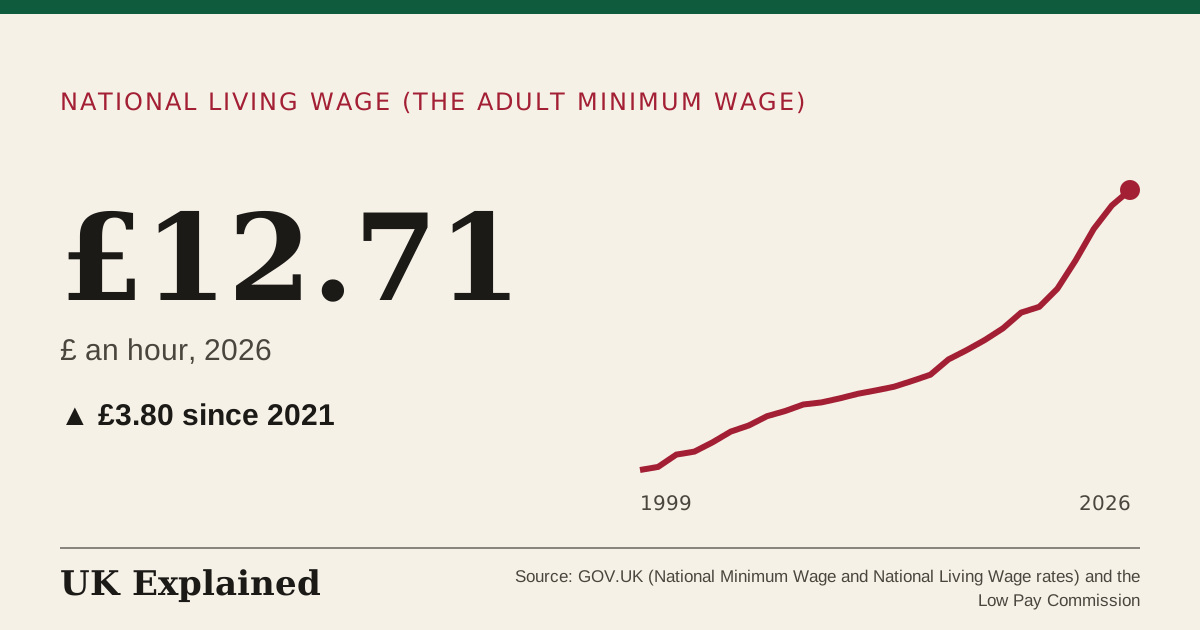
- £ an hour · 1999 to 2026 · Source: GOV.UK (National Minimum Wage and National Living Wage rates) and the Low Pay Commission · Updated 12 November 2026
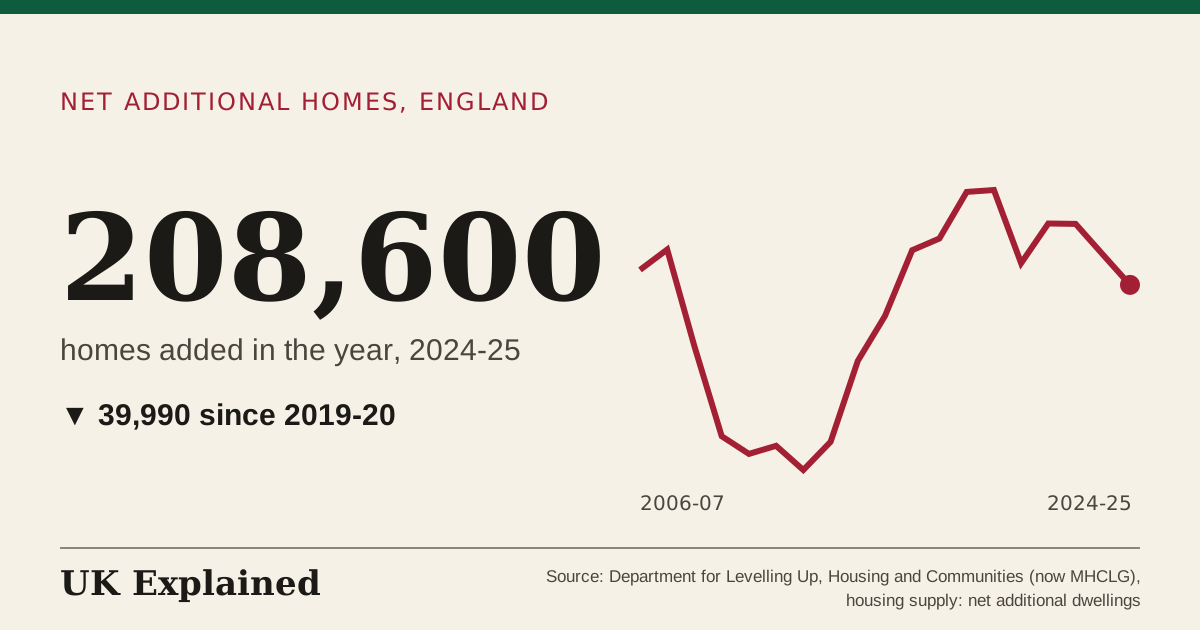
- homes added in the year · 2006–07 to 2024–25 · Source: Department for Levelling Up, Housing and Communities (now MHCLG), housing supply: net additional dwellings · Updated 7 November 2026
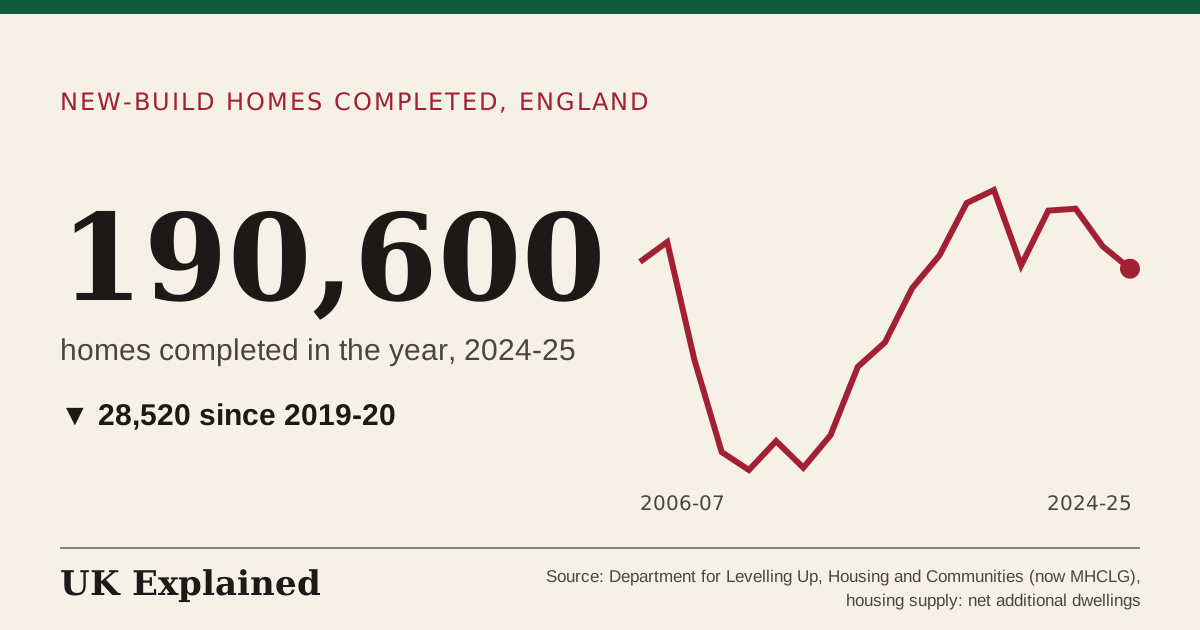
- homes completed in the year · 2006–07 to 2024–25 · Source: Department for Levelling Up, Housing and Communities (now MHCLG), housing supply: net additional dwellings · Updated 7 November 2026
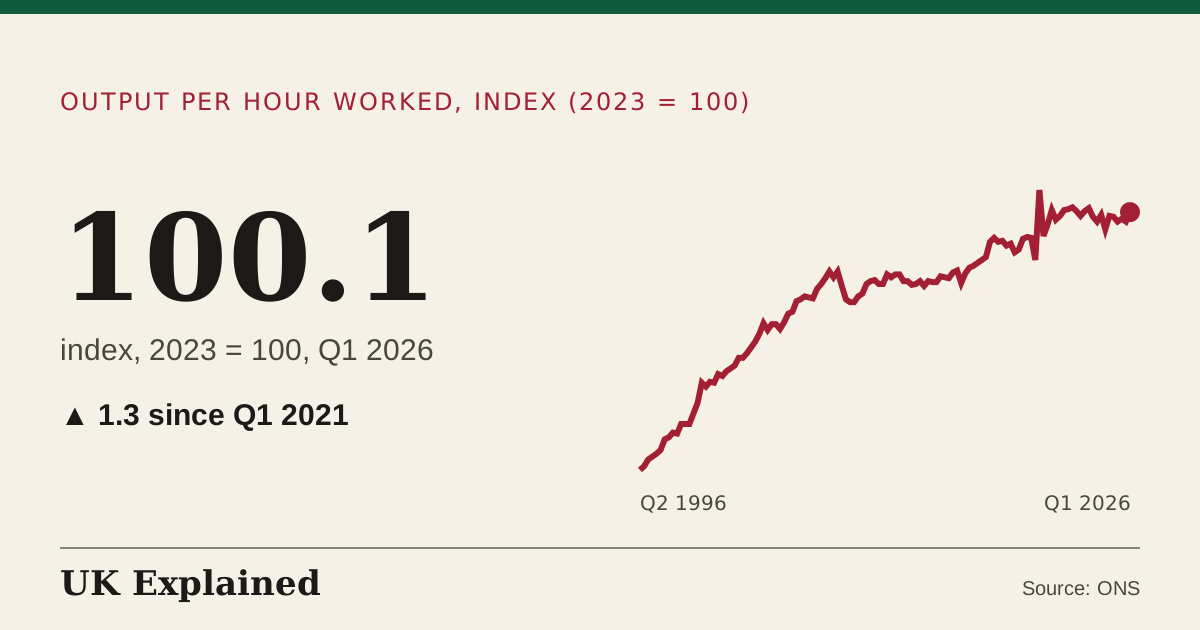
- index, 2023 = 100 · Q1 1990 to Q1 2026 · Source: ONS · Updated 7 November 2026
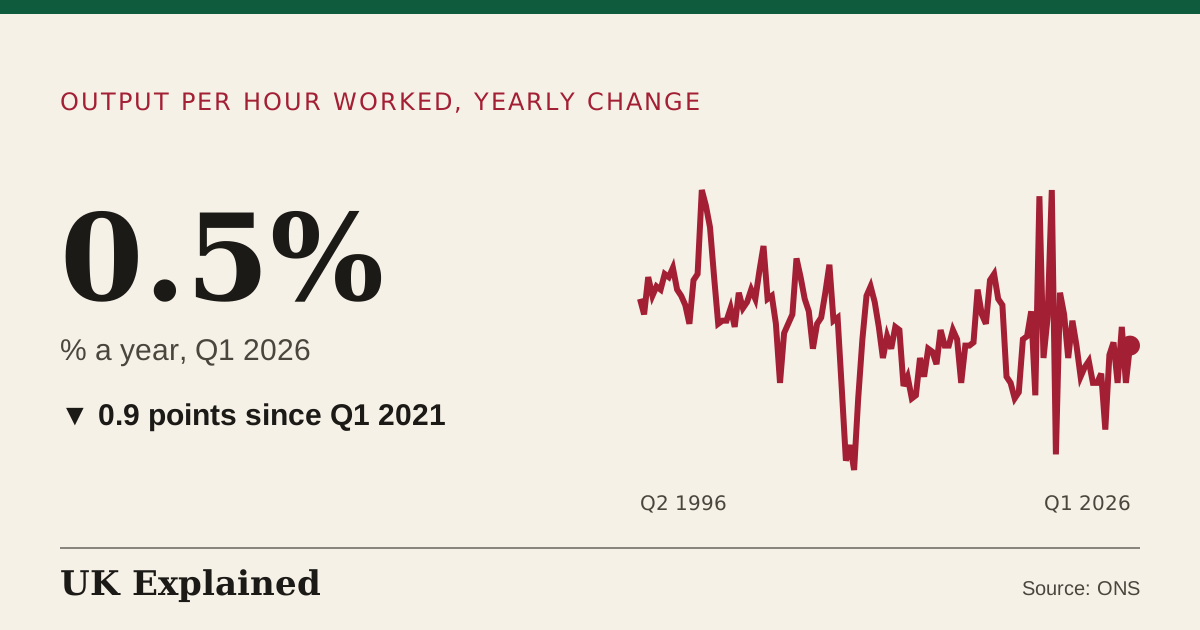
- % a year · Q1 1990 to Q1 2026 · Source: ONS · Updated 7 November 2026
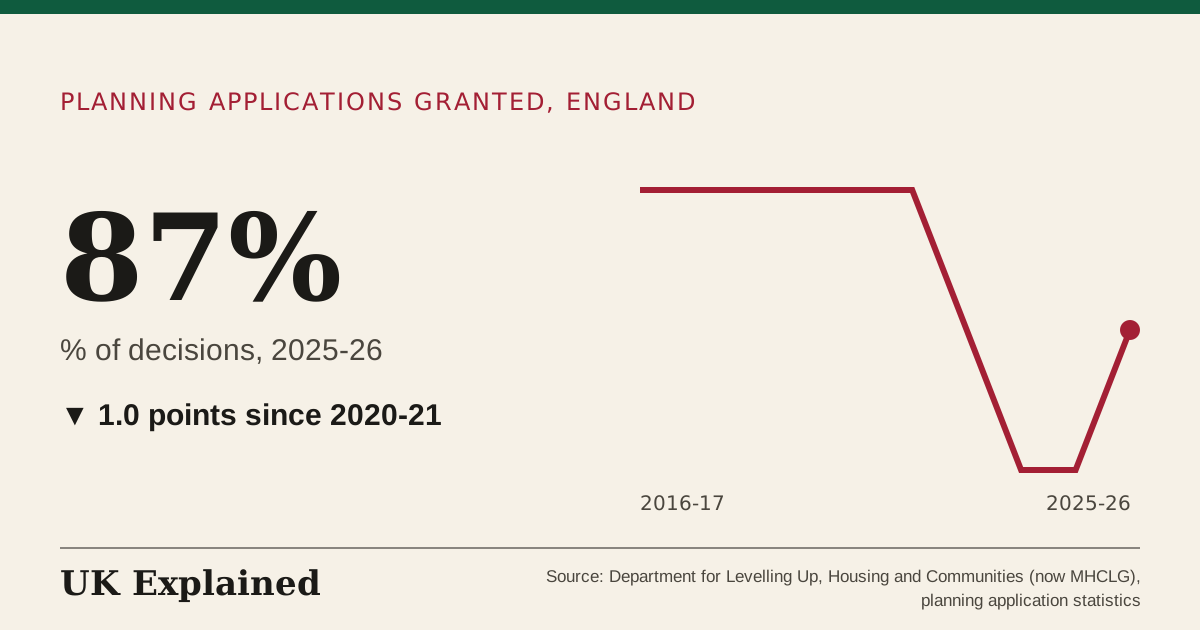
- % of decisions · 2016–17 to 2025–26 · Source: Department for Levelling Up, Housing and Communities (now MHCLG), planning application statistics · Updated 7 November 2026
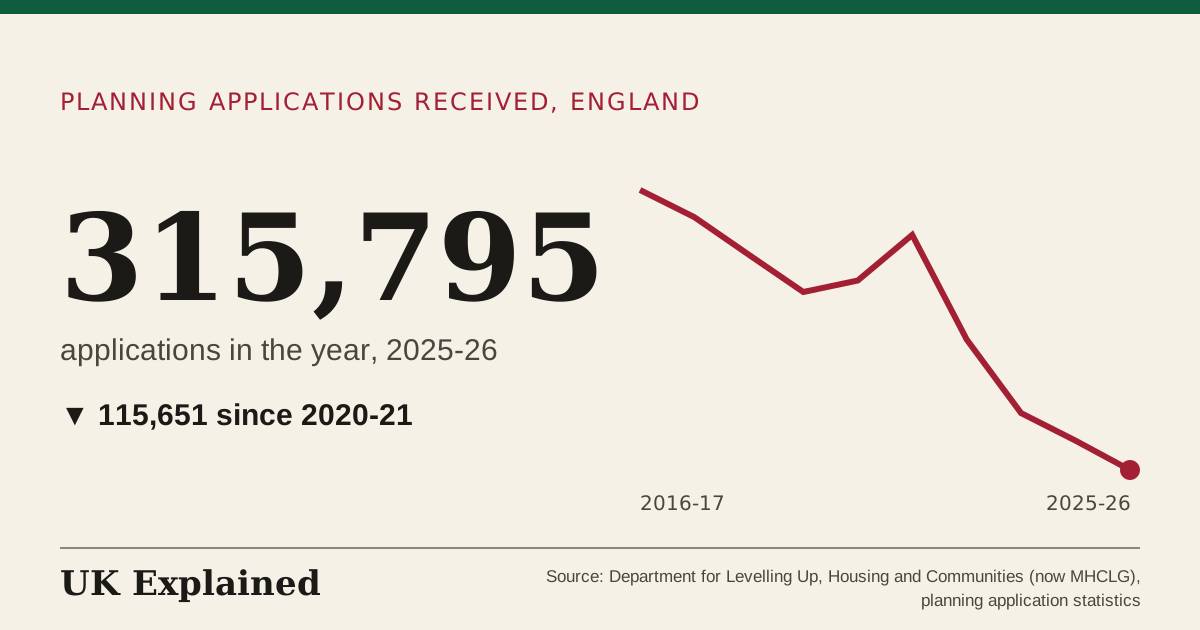
- applications in the year · 2016–17 to 2025–26 · Source: Department for Levelling Up, Housing and Communities (now MHCLG), planning application statistics · Updated 7 November 2026
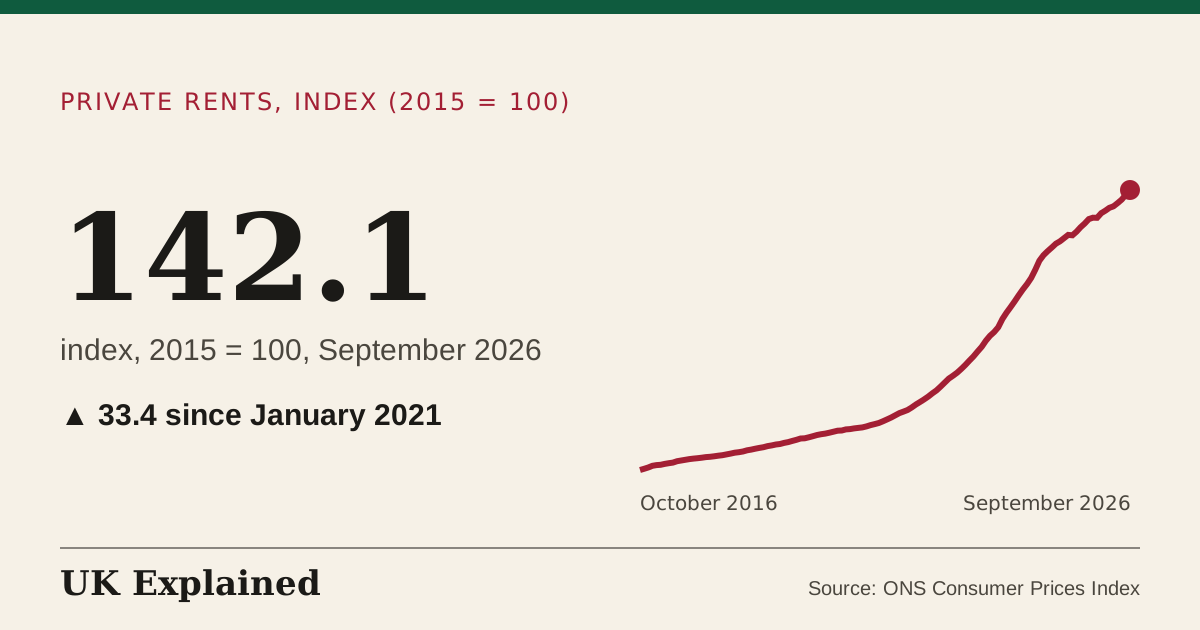
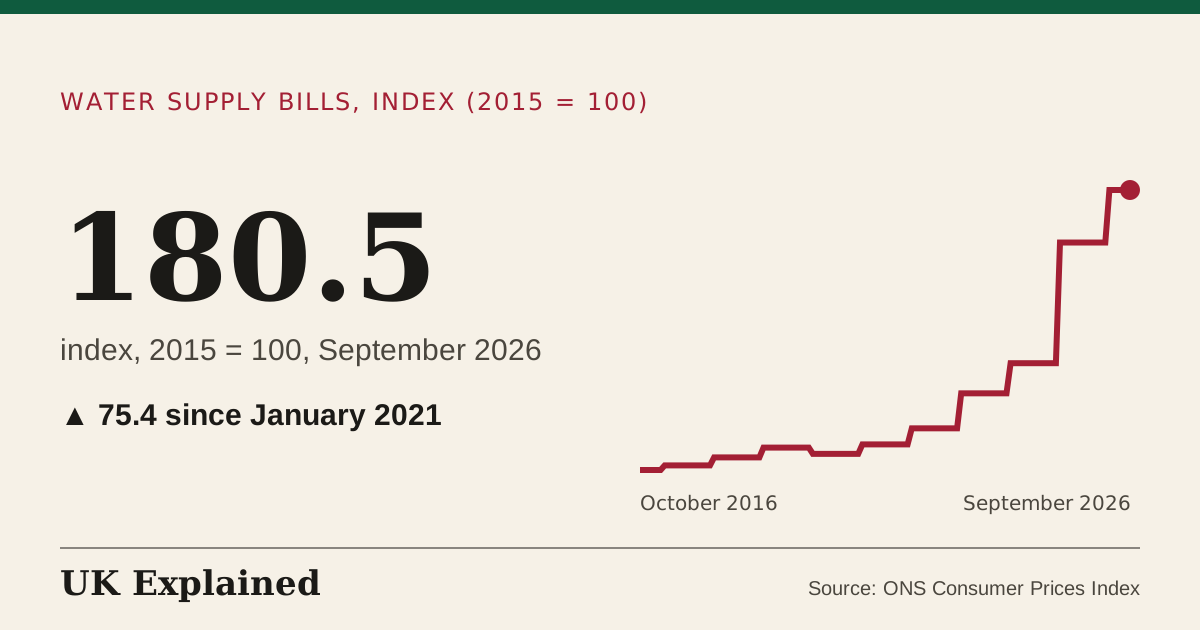
- index, 2015 = 100 · January 1998 to September 2026 · Source: ONS Consumer Prices Index · Updated 7 November 2026
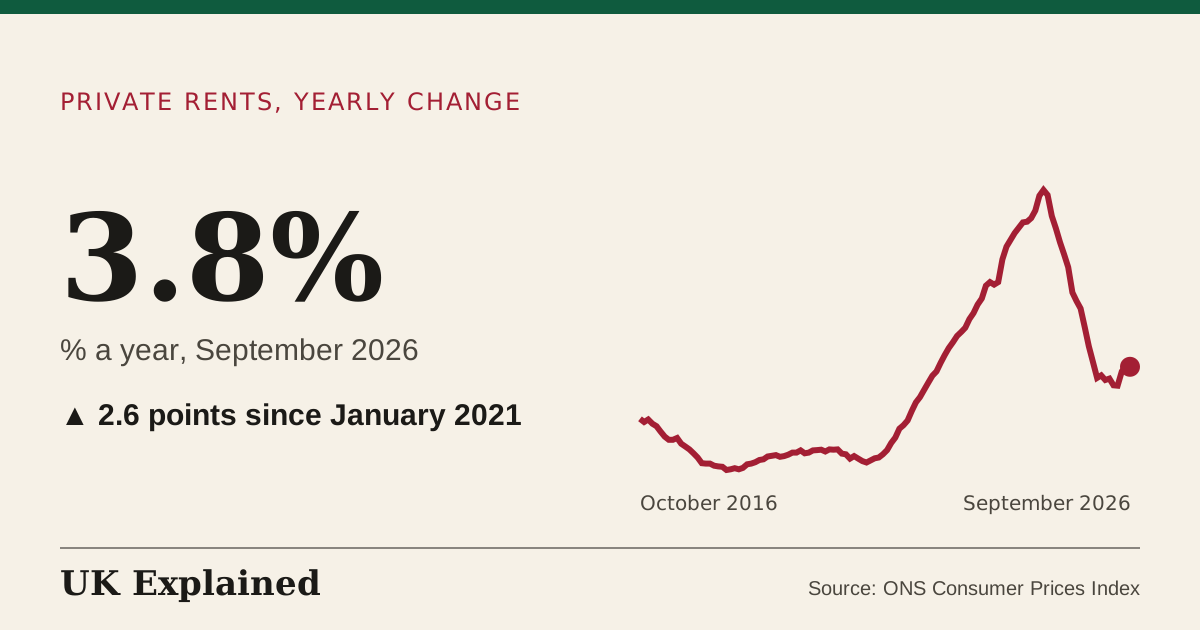
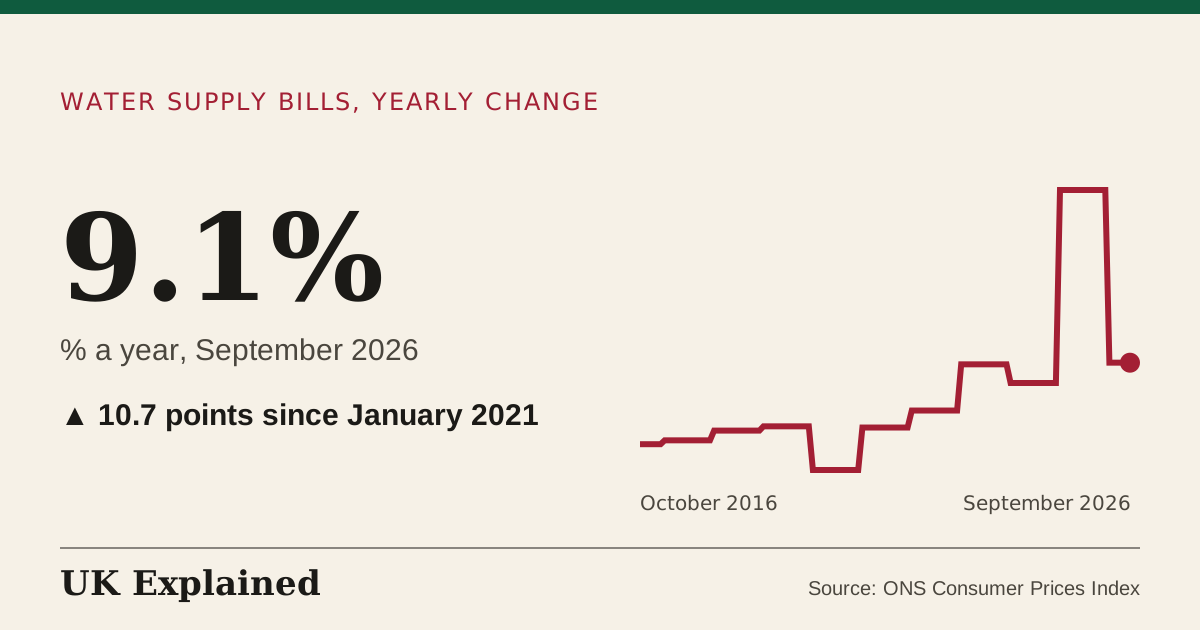
- % a year · January 1998 to September 2026 · Source: ONS Consumer Prices Index · Updated 7 November 2026
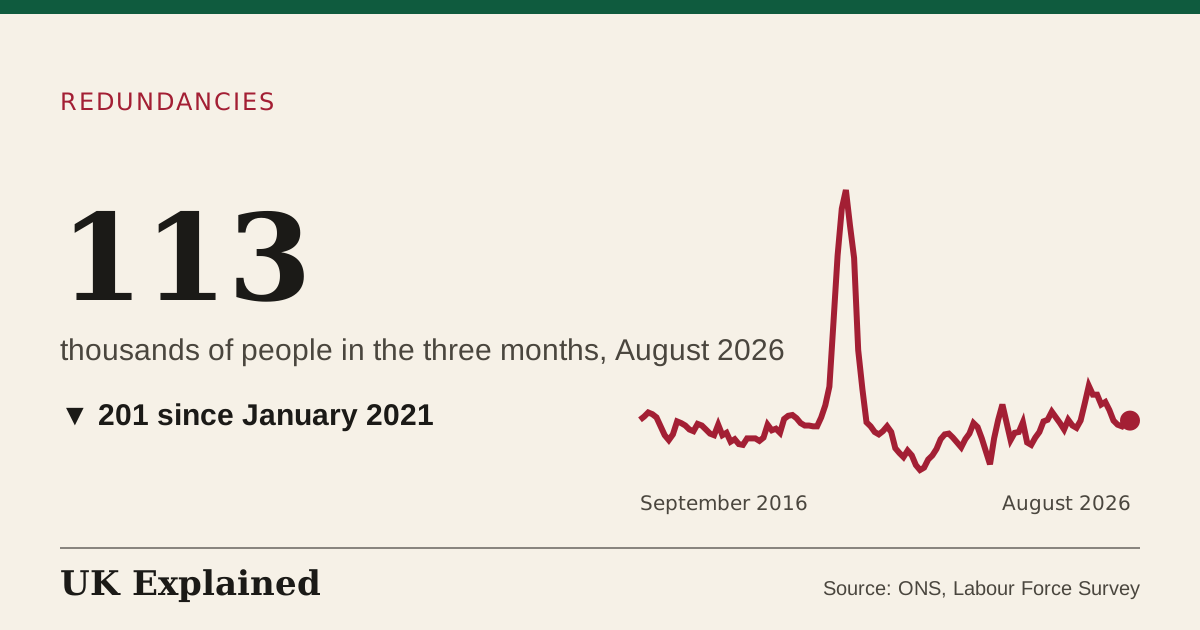
- thousands of people in the three months · May 1995 to August 2026 · Source: ONS, Labour Force Survey · Updated 7 November 2026
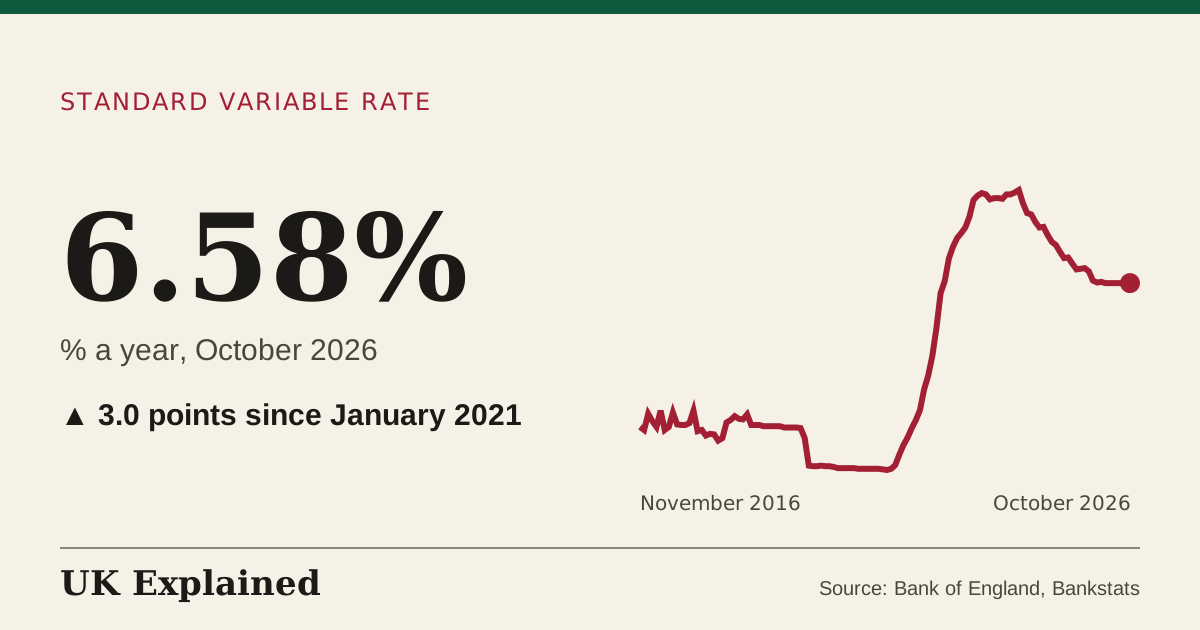
- % a year · January 1995 to October 2026 · Source: Bank of England, Bankstats · Updated 12 November 2026
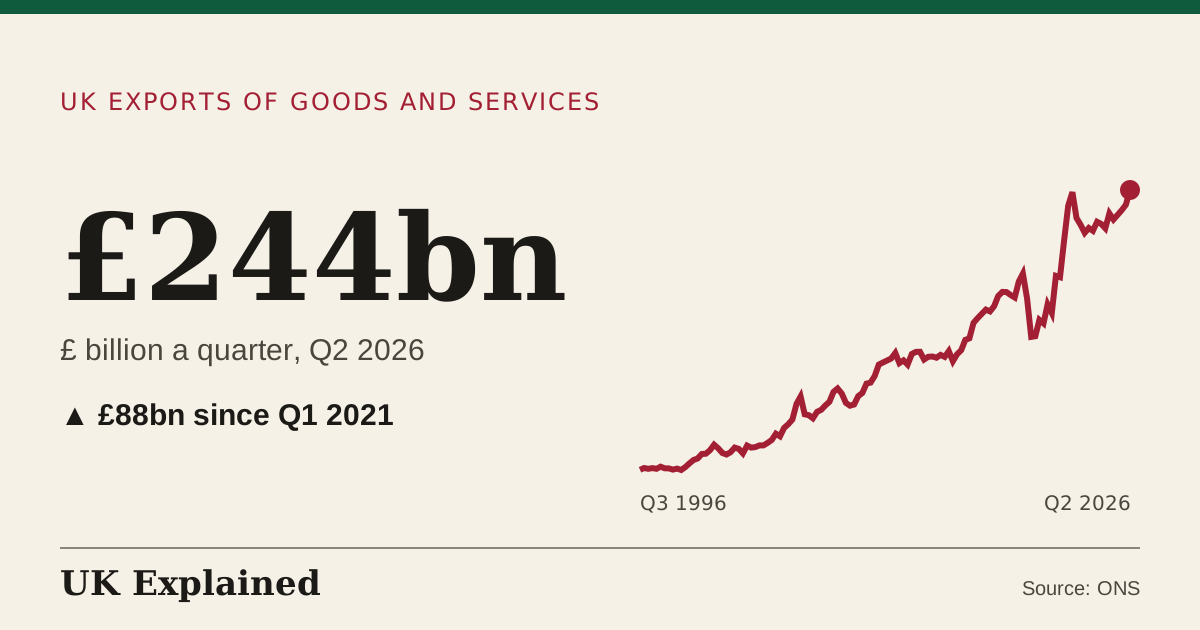
- £ billion a quarter · Q1 1990 to Q2 2026 · Source: ONS · Updated 7 November 2026
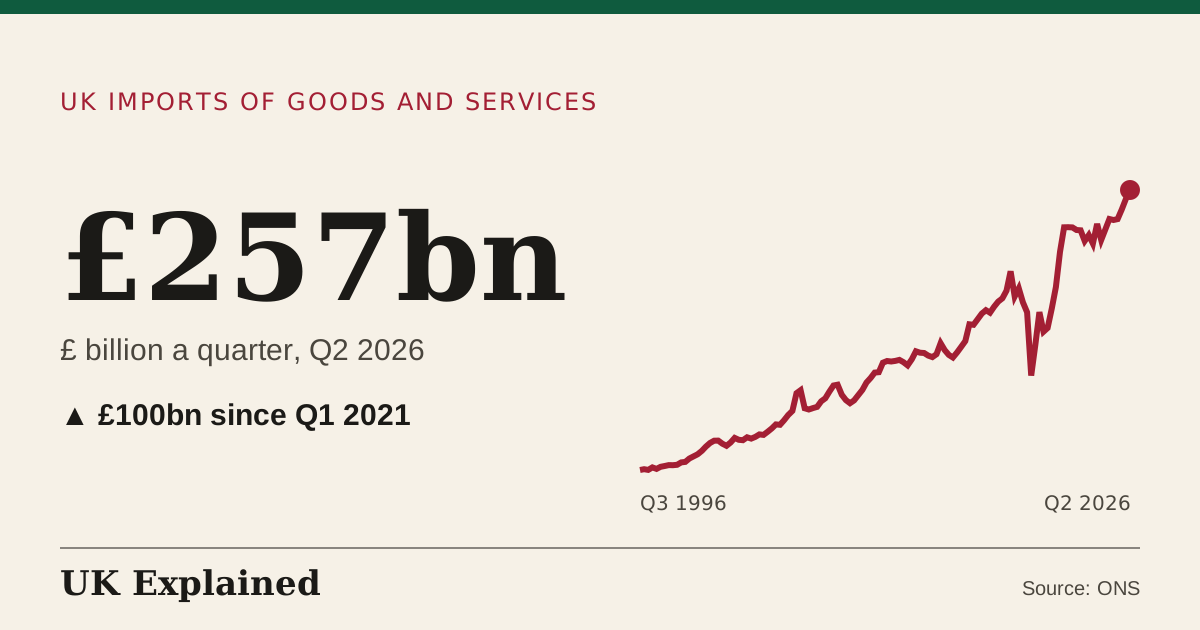
- £ billion a quarter · Q1 1990 to Q2 2026 · Source: ONS · Updated 7 November 2026
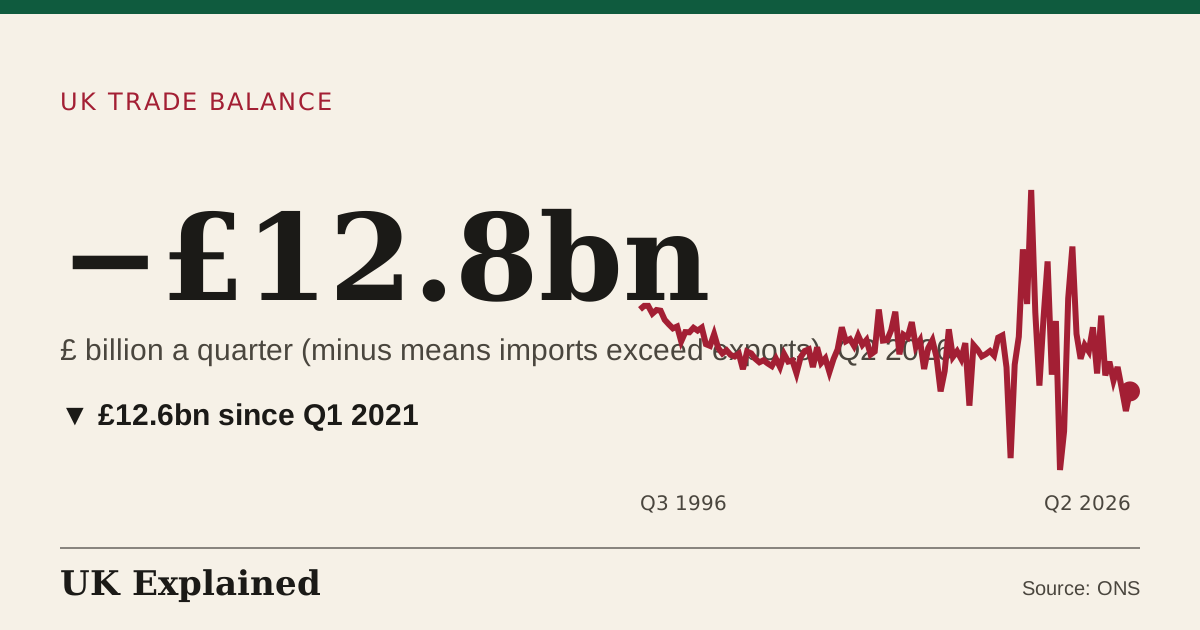
- £ billion a quarter (minus means imports exceed exports) · Q1 1990 to Q2 2026 · Source: ONS · Updated 7 November 2026
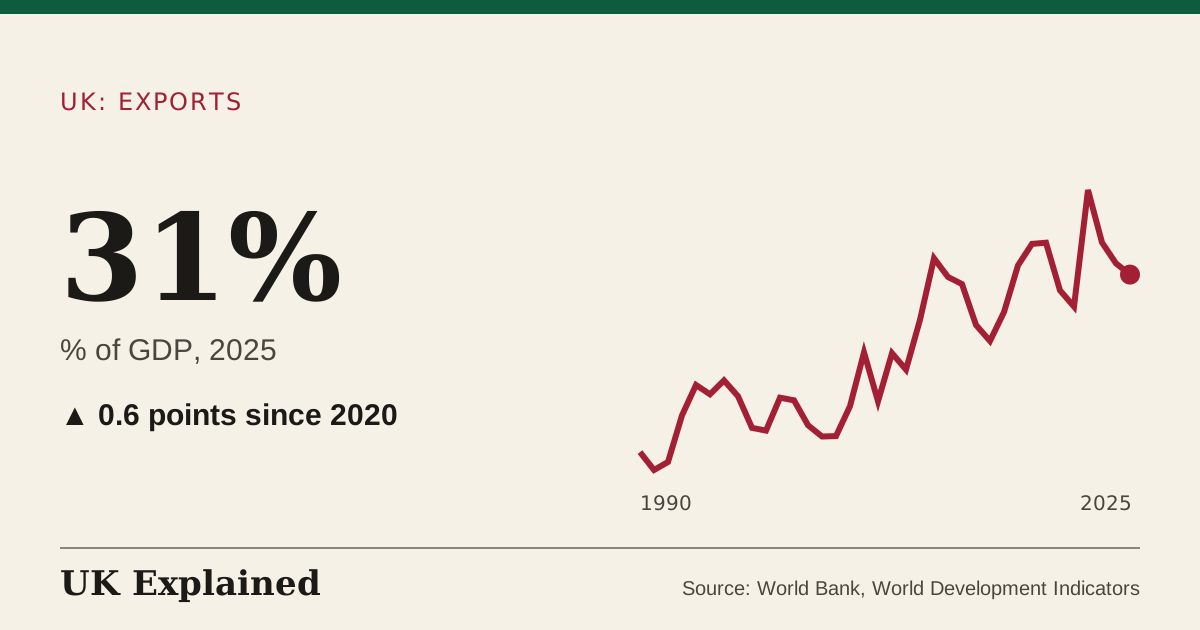
- % of GDP · 1990 to 2025 · Source: World Bank, World Development Indicators · Updated 7 November 2026
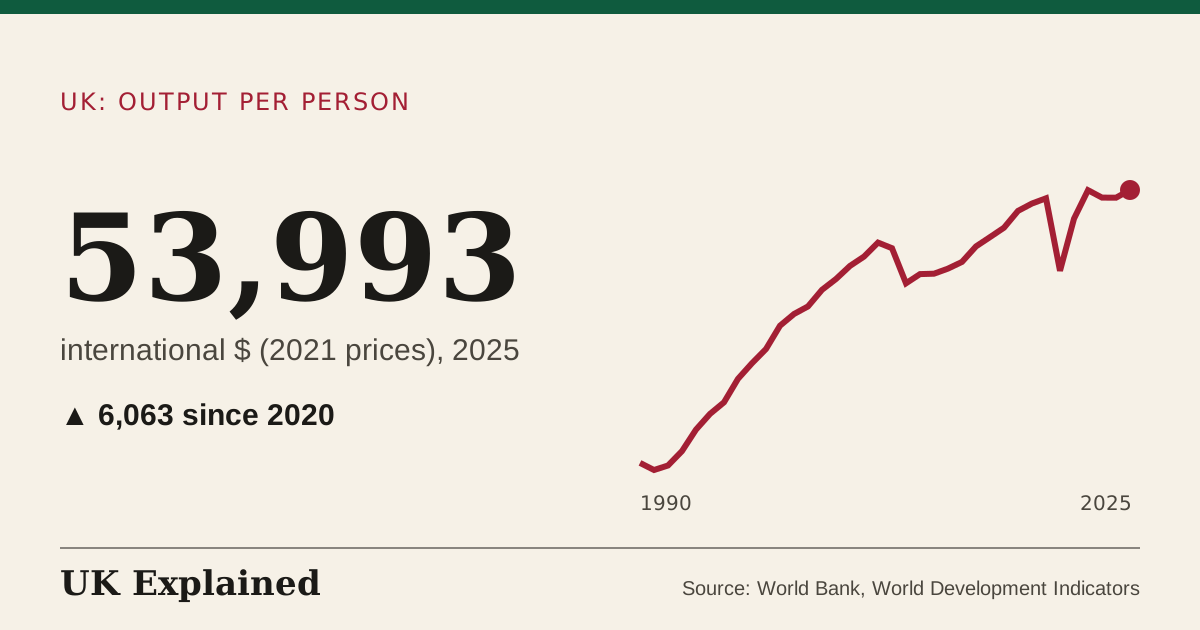
- international $ (2021 prices) · 1990 to 2025 · Source: World Bank, World Development Indicators · Updated 7 November 2026
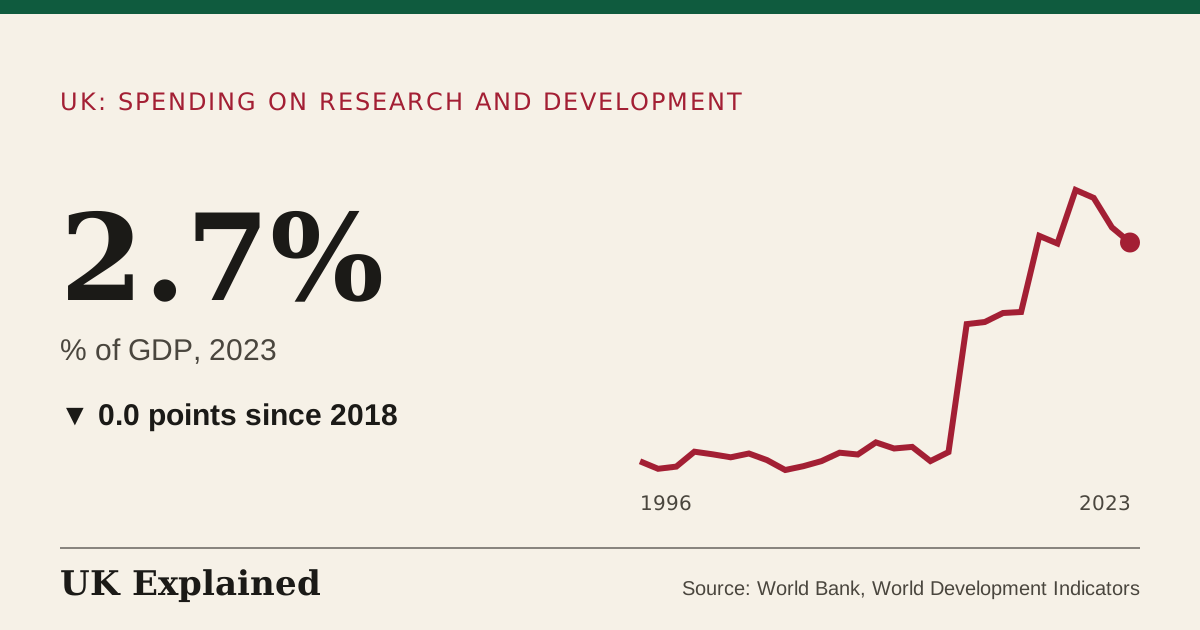
- % of GDP · 1996 to 2023 · Source: World Bank, World Development Indicators · Updated 7 November 2026
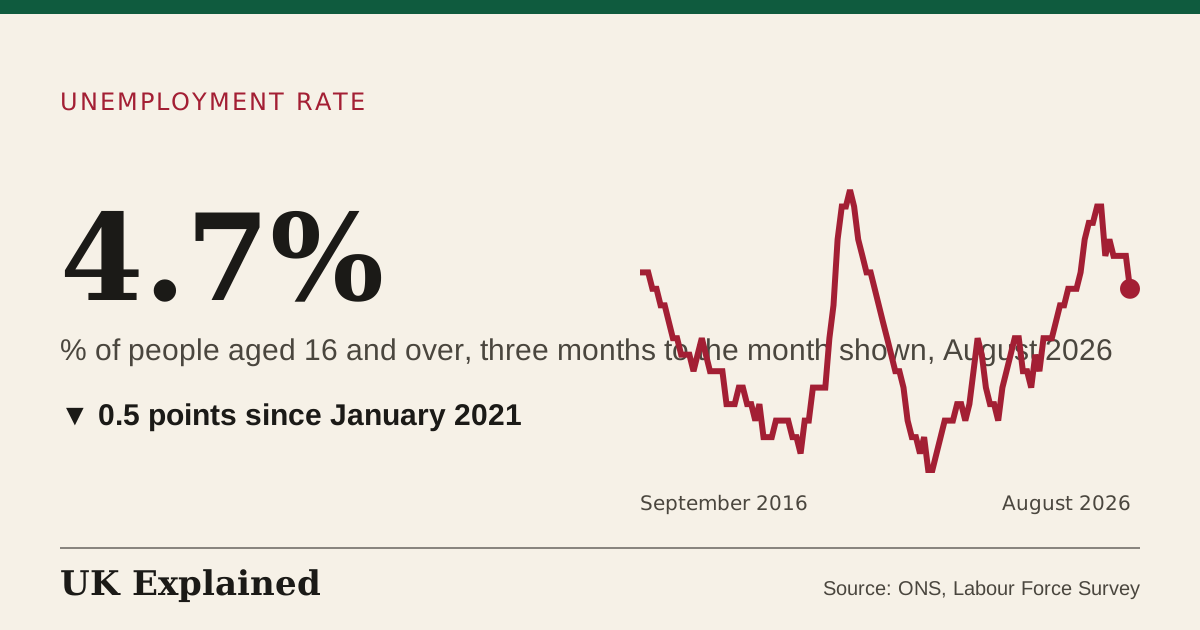
- % of people aged 16 and over, three months to the month shown · March 1971 to August 2026 · Source: ONS, Labour Force Survey · Updated 7 November 2026
Housing
(2)
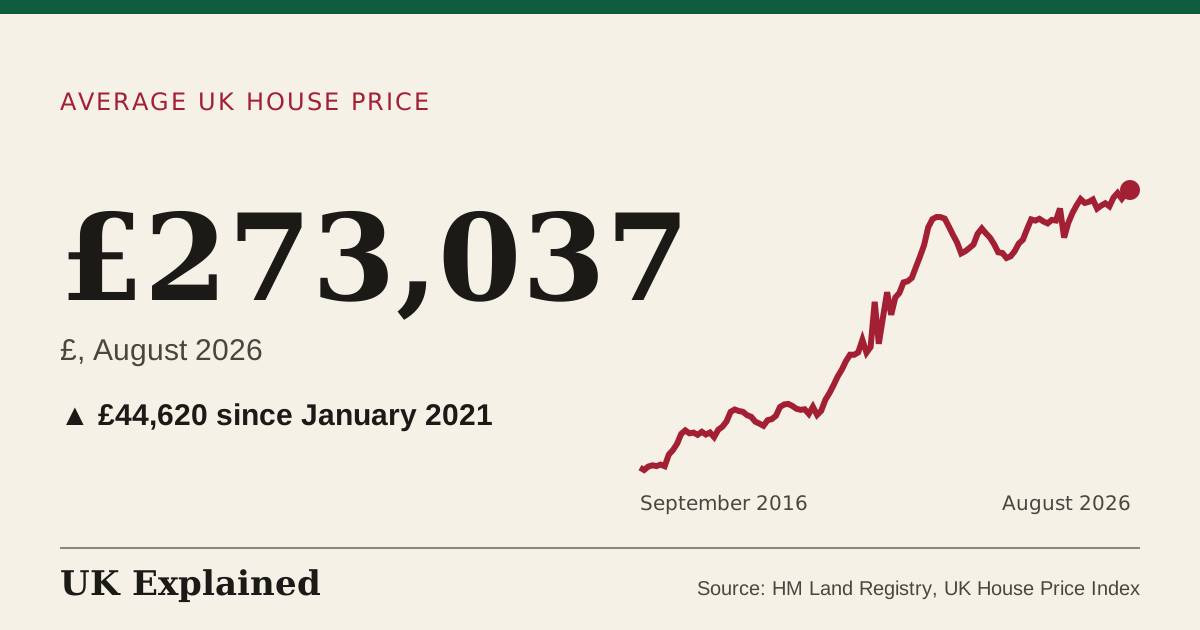
- £ · January 2000 to August 2026 · Source: HM Land Registry, UK House Price Index · Updated 7 November 2026
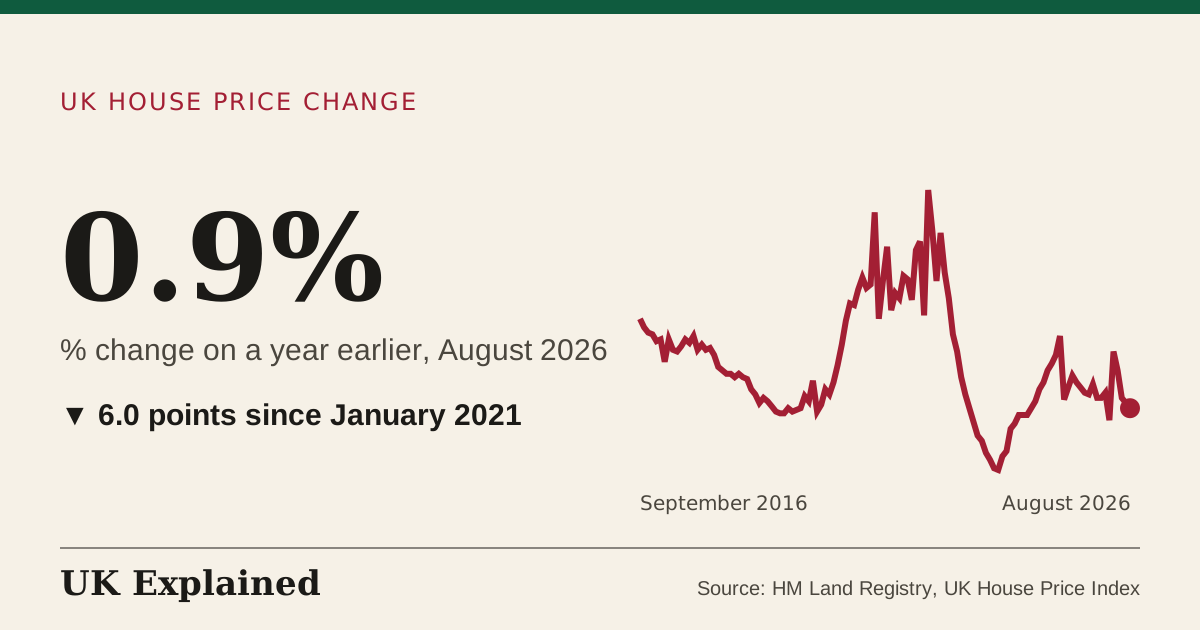
- % change on a year earlier · January 2000 to August 2026 · Source: HM Land Registry, UK House Price Index · Updated 7 November 2026
Health and the NHS
(8)
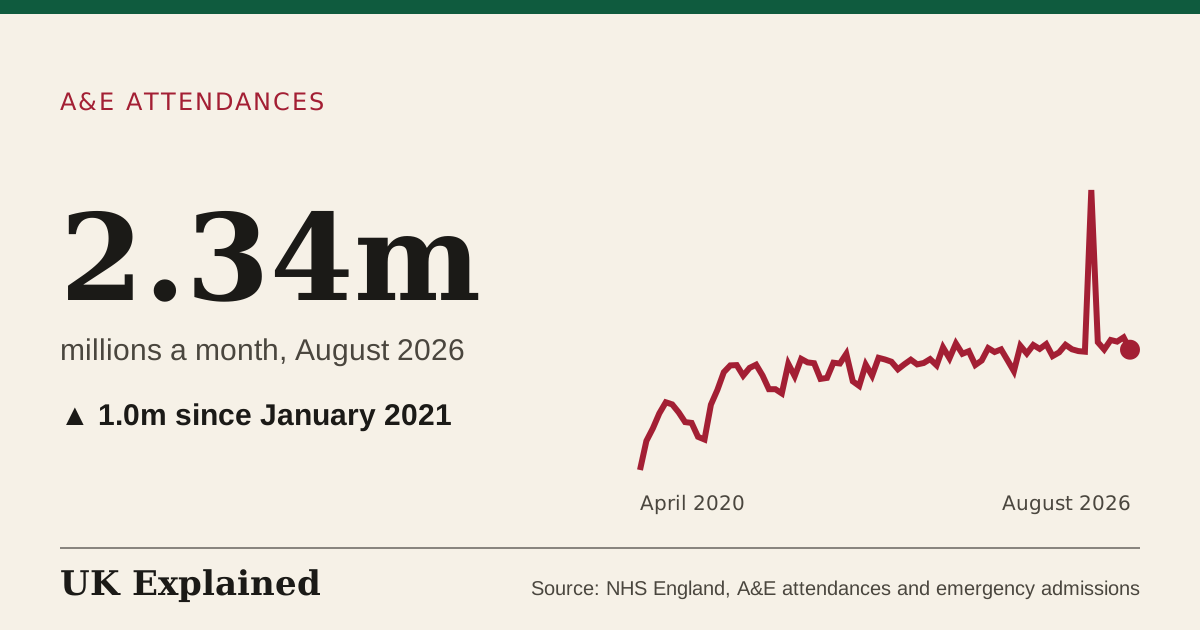
- millions a month · April 2020 to August 2026 · Source: NHS England, A&E attendances and emergency admissions · Updated 7 November 2026
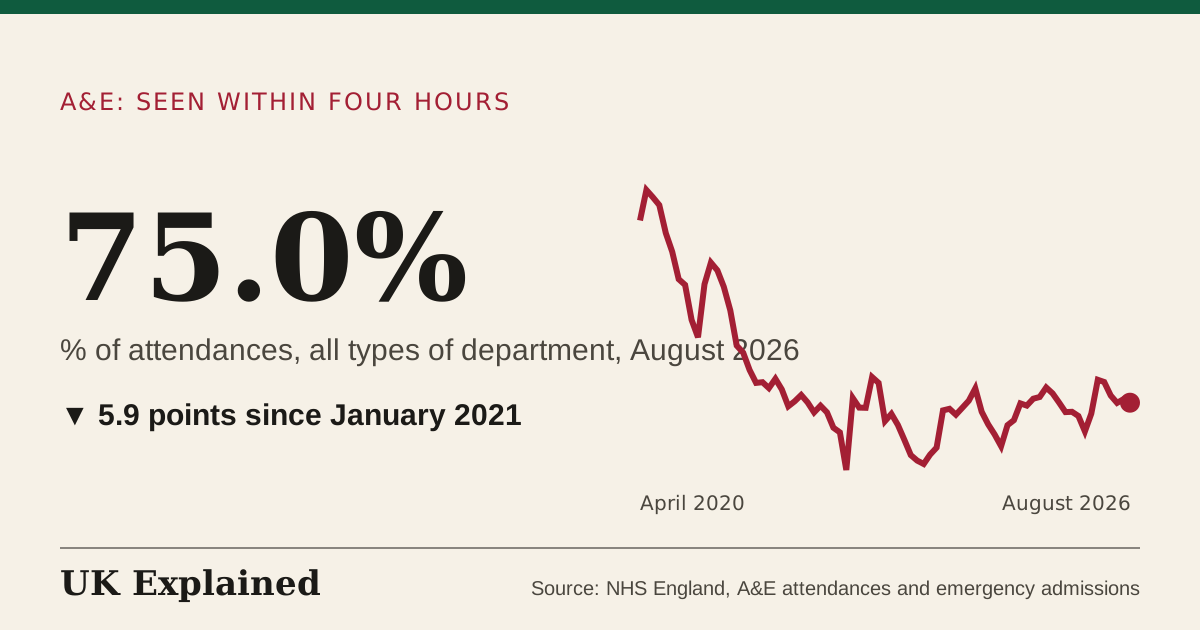
- % of attendances, all types of department · April 2020 to August 2026 · Source: NHS England, A&E attendances and emergency admissions · Updated 7 November 2026
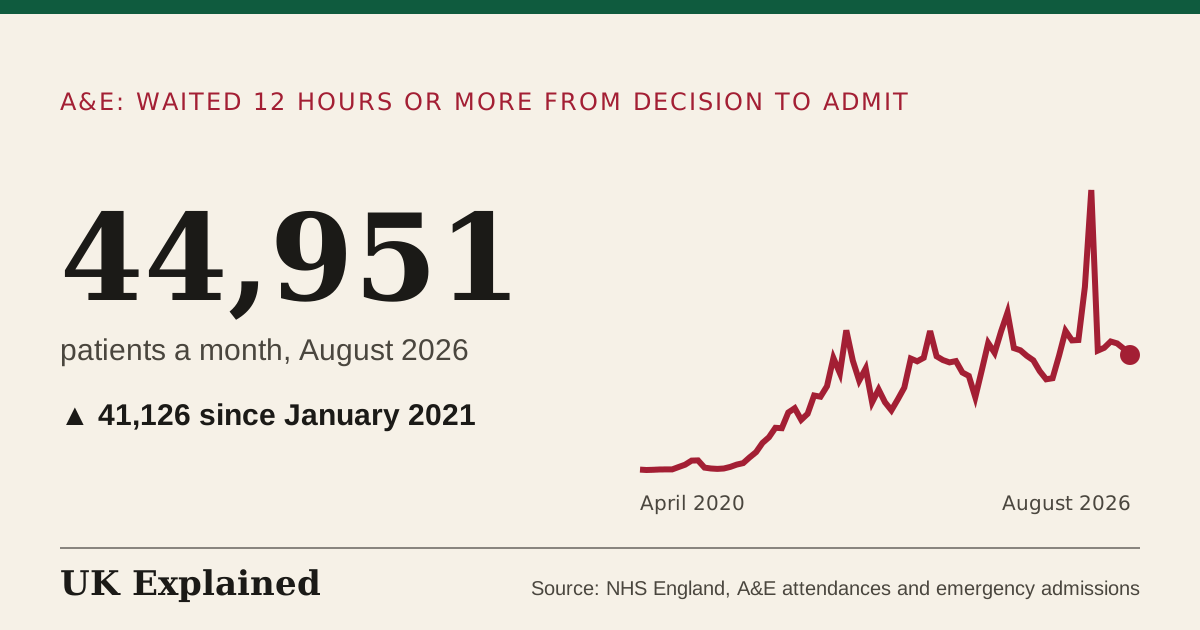
- patients a month · April 2020 to August 2026 · Source: NHS England, A&E attendances and emergency admissions · Updated 7 November 2026
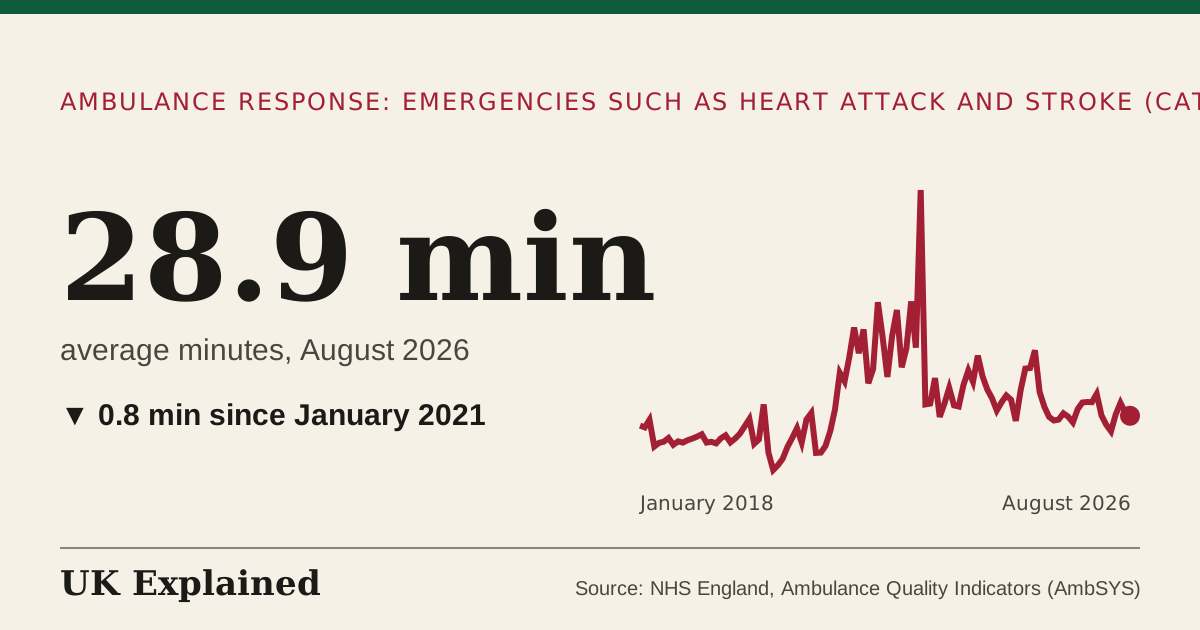
- average minutes · January 2018 to August 2026 · Source: NHS England, Ambulance Quality Indicators (AmbSYS) · Updated 7 November 2026
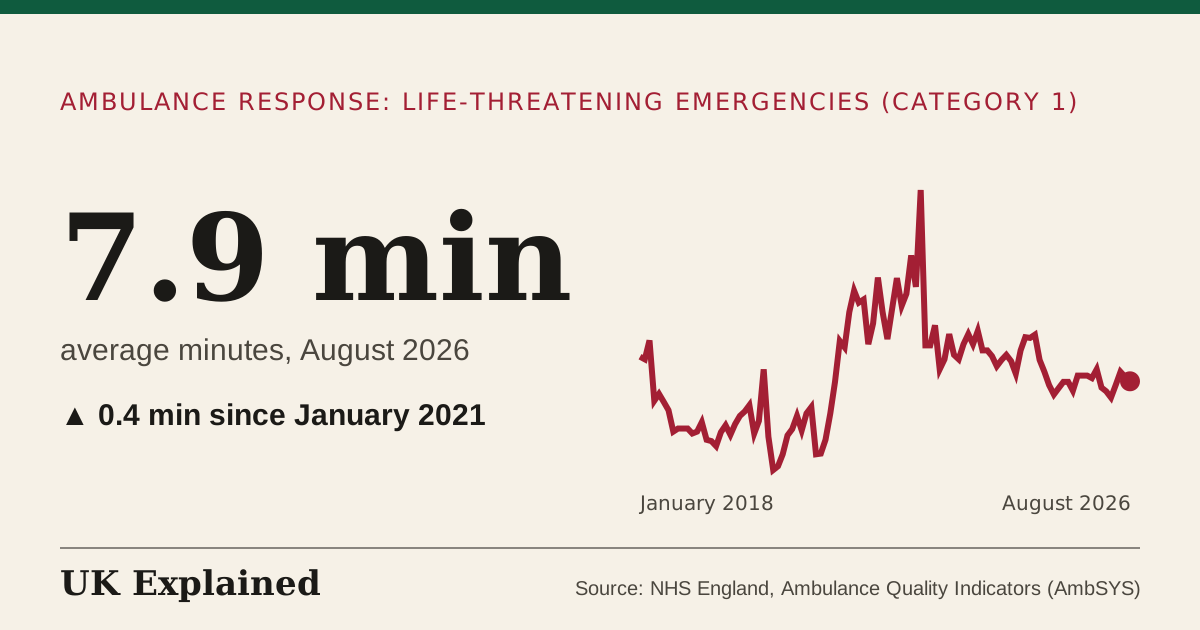
- average minutes · January 2018 to August 2026 · Source: NHS England, Ambulance Quality Indicators (AmbSYS) · Updated 7 November 2026
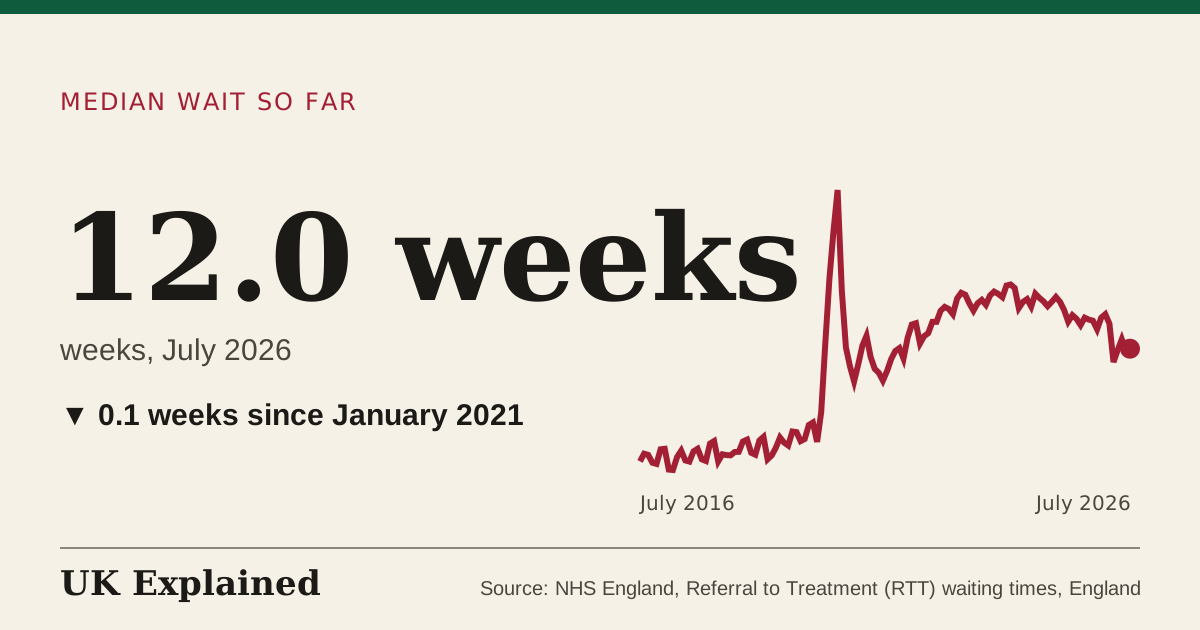
- weeks · August 2007 to July 2026 · Source: NHS England, Referral to Treatment (RTT) waiting times, England · Updated 7 November 2026
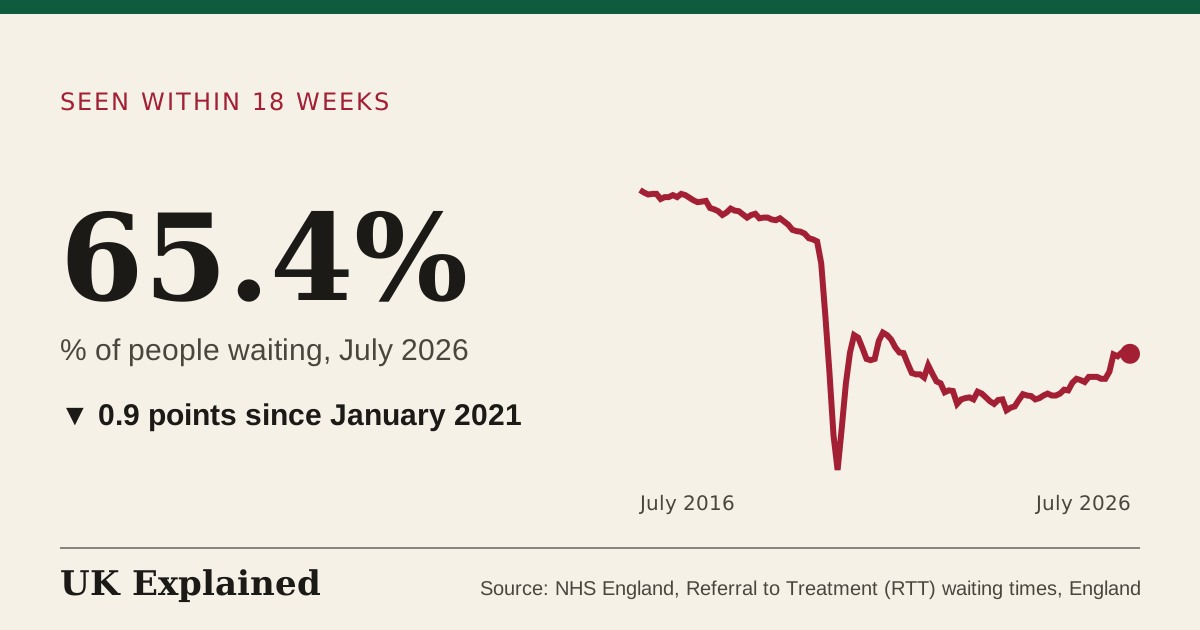
- % of people waiting · August 2007 to July 2026 · Source: NHS England, Referral to Treatment (RTT) waiting times, England · Updated 7 November 2026
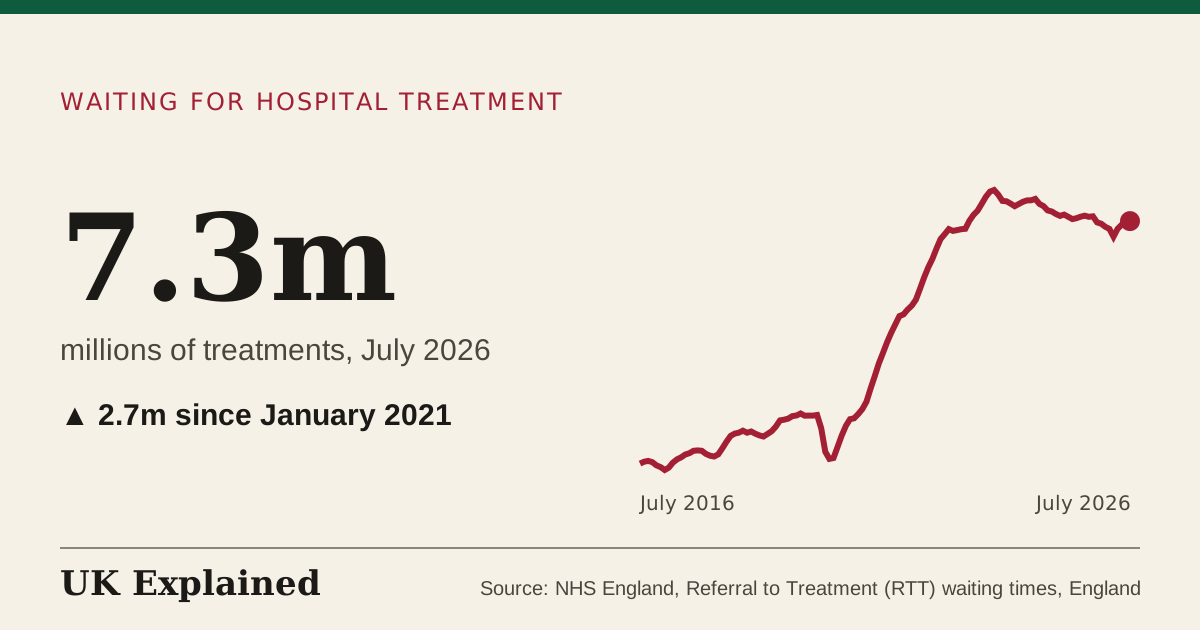
- millions of treatments · August 2007 to July 2026 · Source: NHS England, Referral to Treatment (RTT) waiting times, England · Updated 7 November 2026
Energy and electricity
(28)
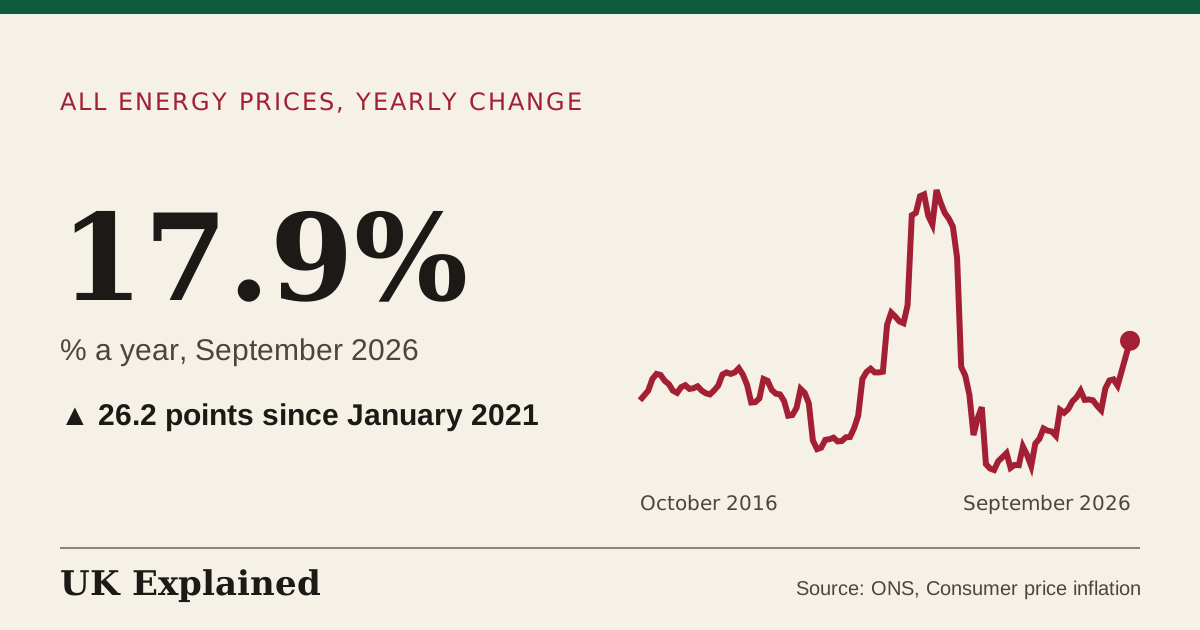
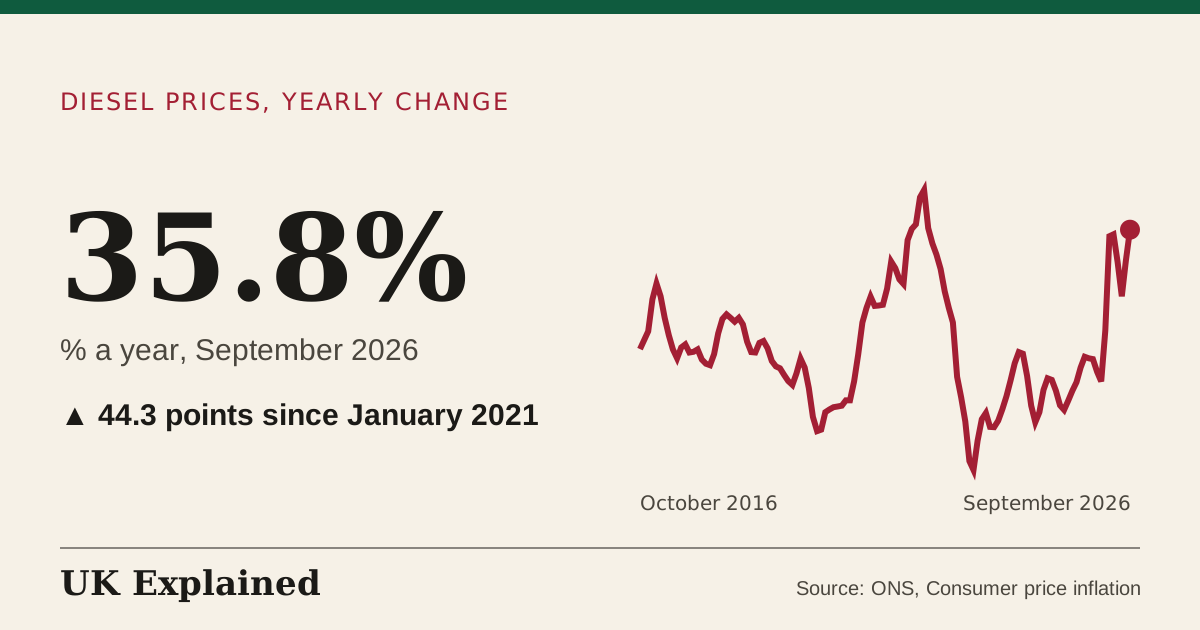
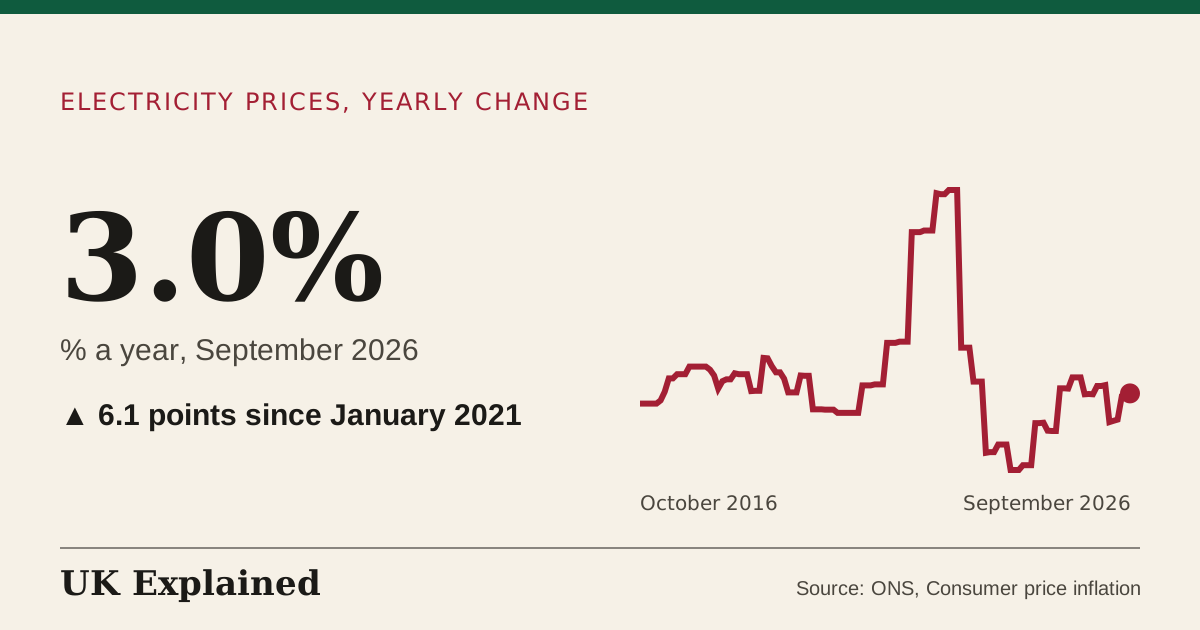
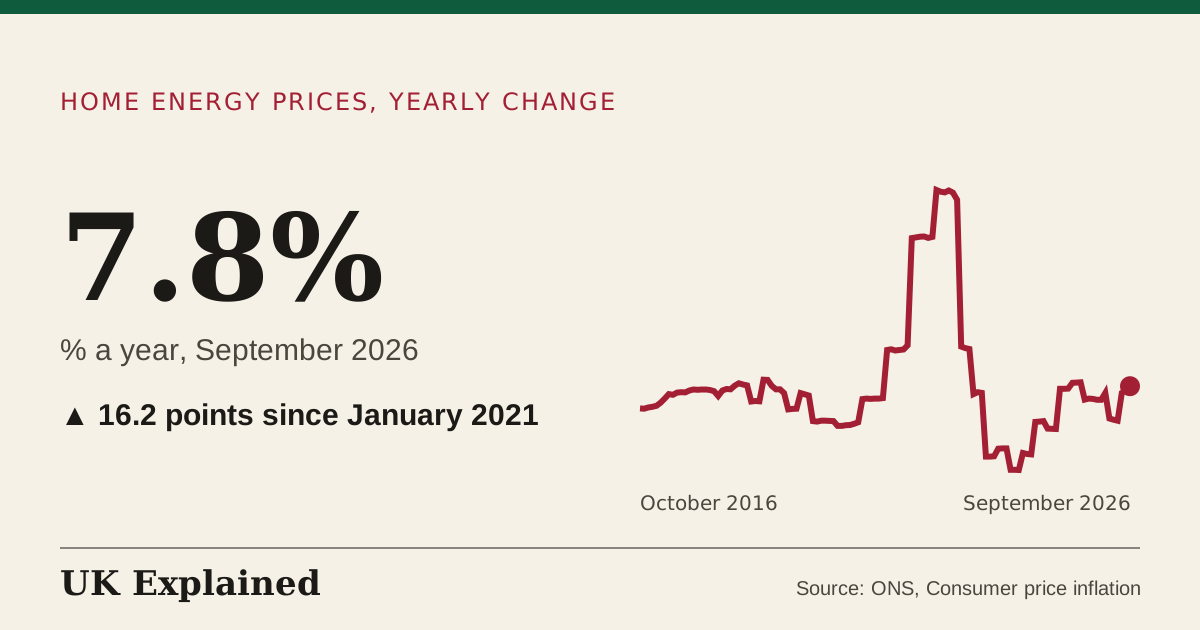
- % a year · January 1989 to September 2026 · Source: ONS, Consumer price inflation · Updated 7 November 2026
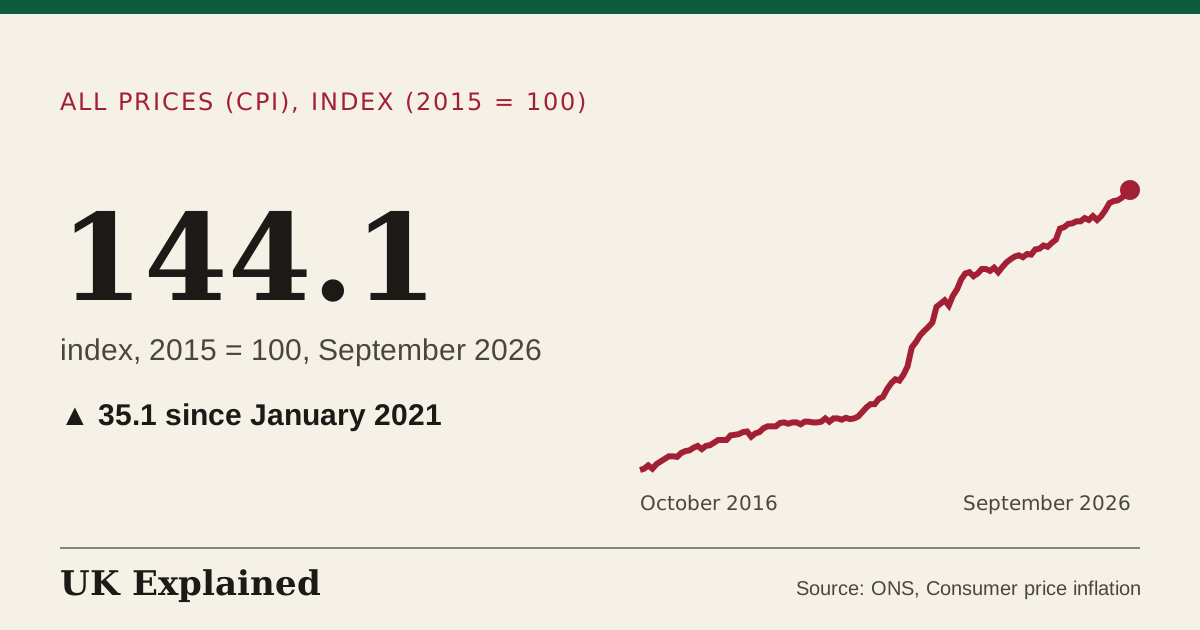
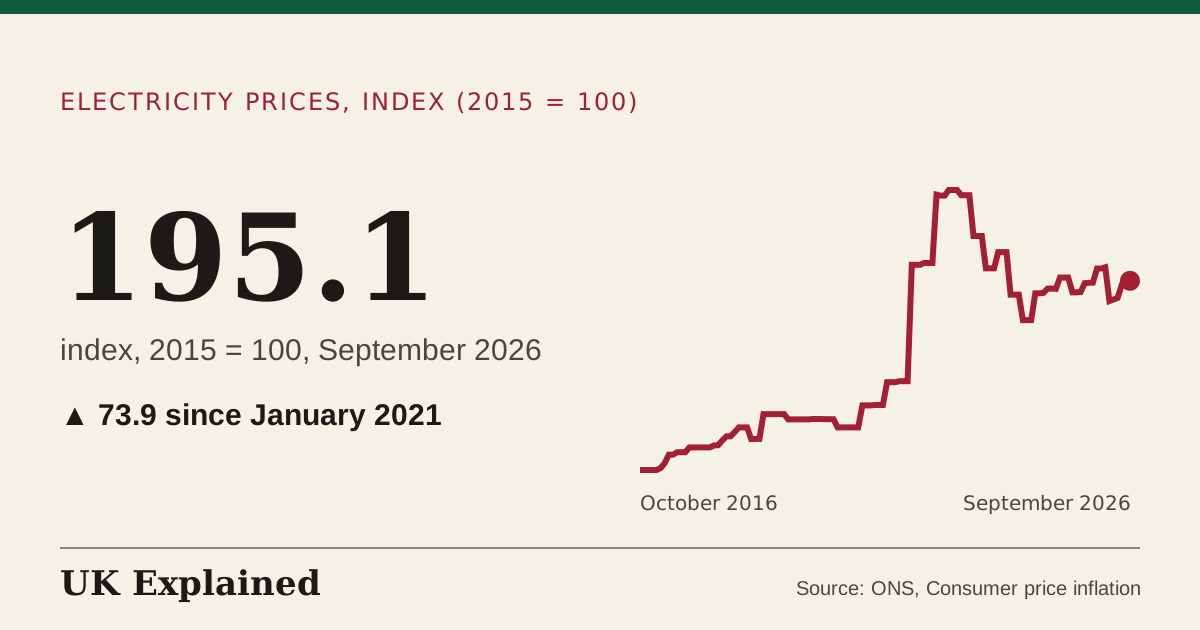
- All prices (CPI), index (2015 = 100)index, 2015 = 100 · January 1988 to September 2026 · Source: ONS, Consumer price inflation · Updated 7 November 2026
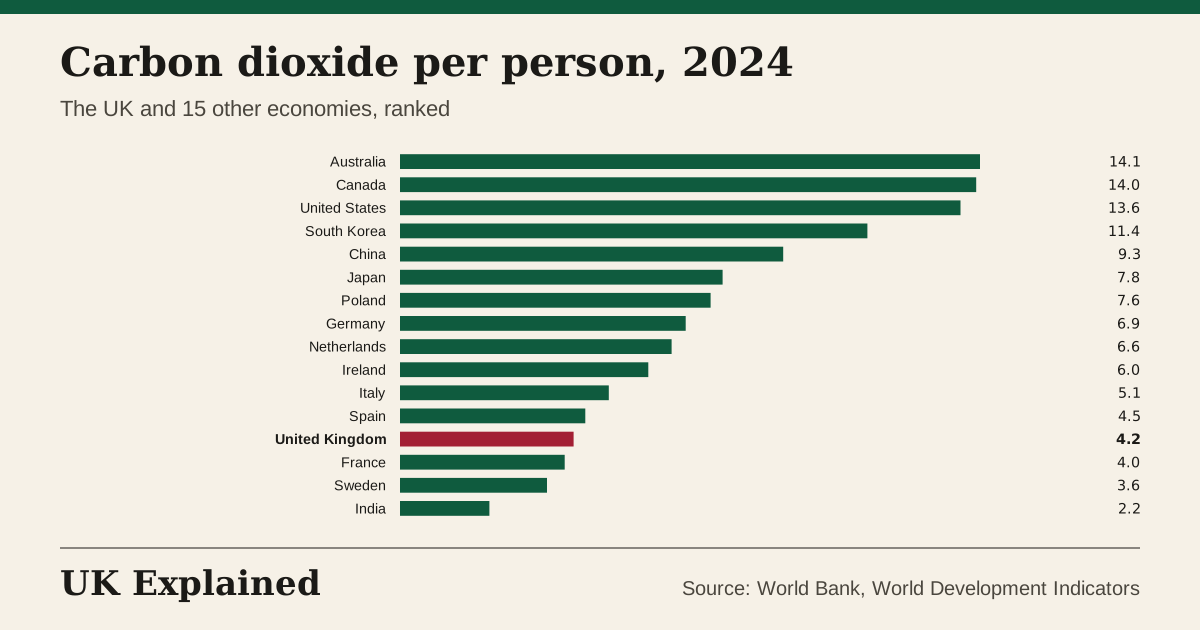
- tonnes · 2024 · Source: World Bank, World Development Indicators · Updated 7 November 2026
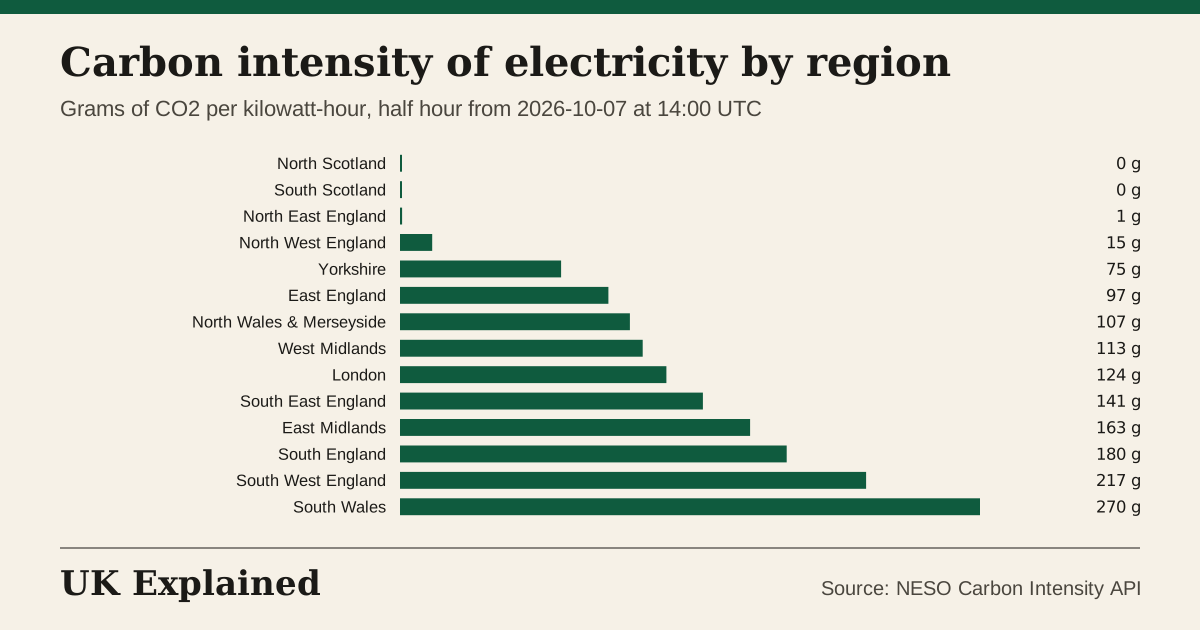
- grams of CO2 per kWh · half hour from 12:00 UTC on 11 November 2026 · Source: NESO Carbon Intensity API · Updated 11 November 2026
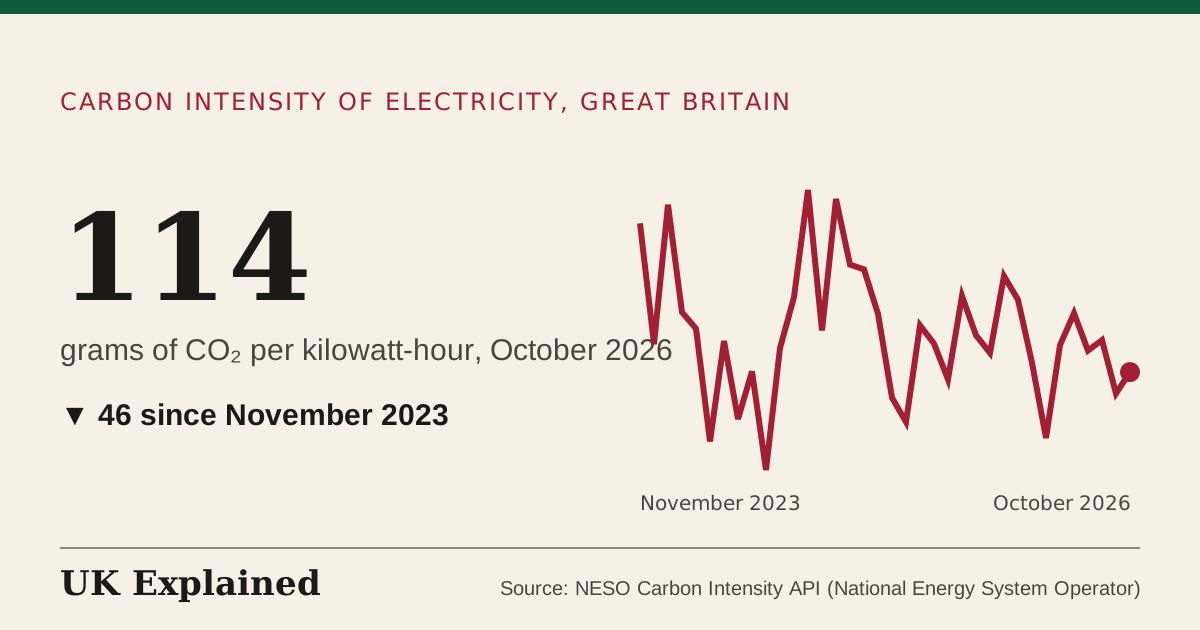
- grams of CO₂ per kilowatt-hour · November 2023 to October 2026 · Source: NESO Carbon Intensity API (National Energy System Operator) · Updated 7 November 2026
- % a year · January 2016 to September 2026 · Source: ONS, Consumer price inflation · Updated 7 November 2026
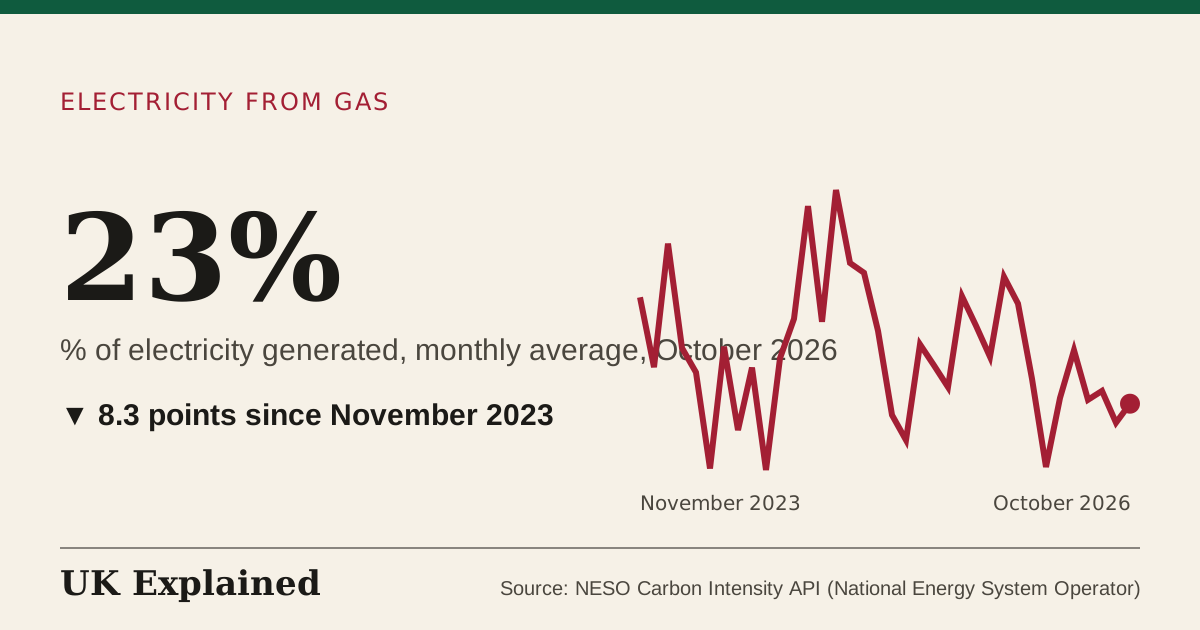
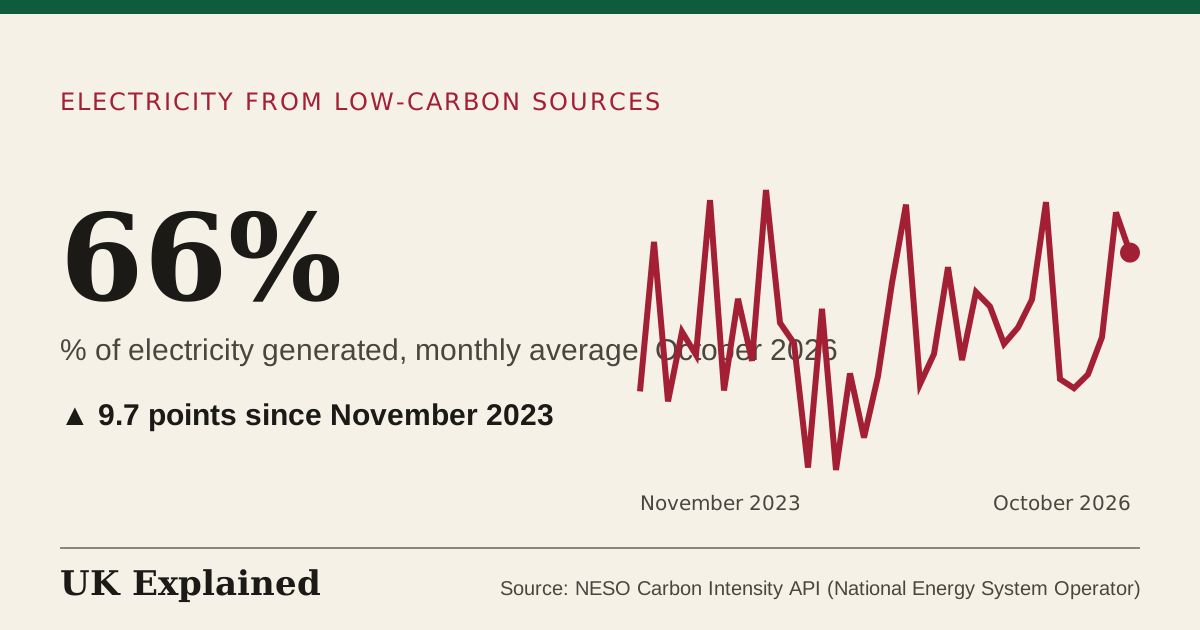
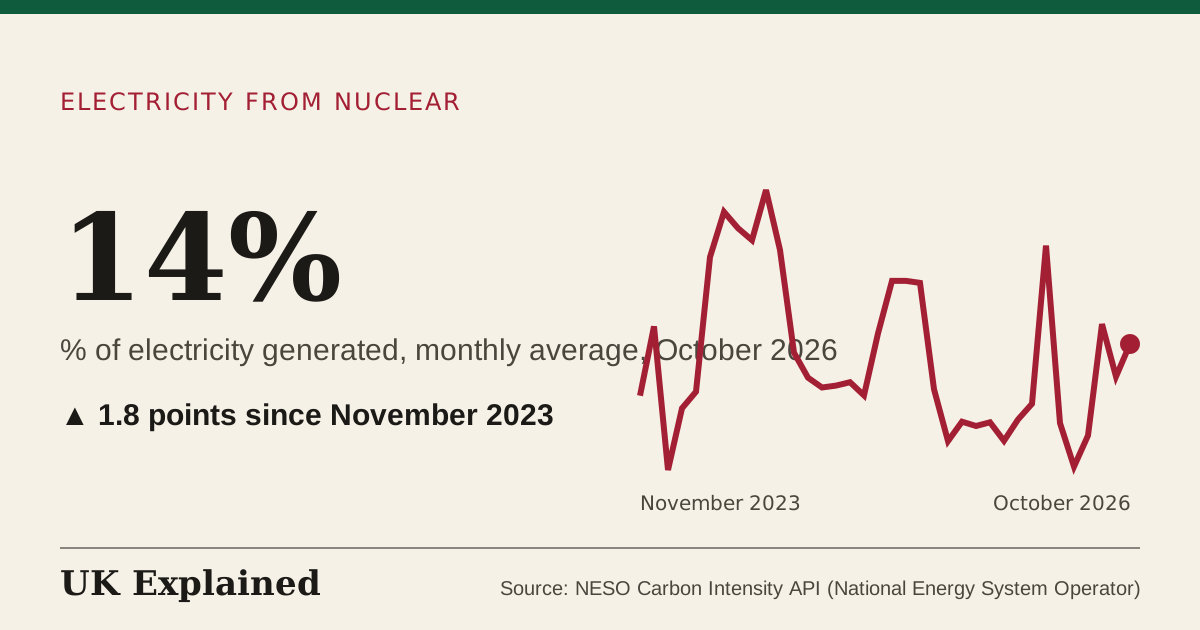
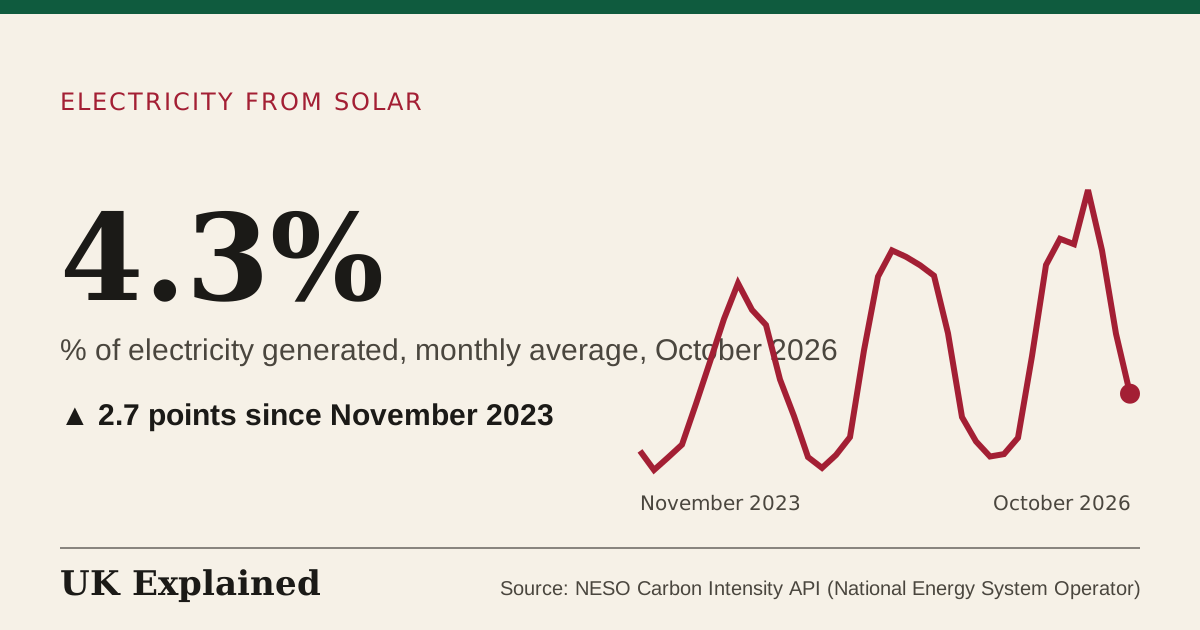
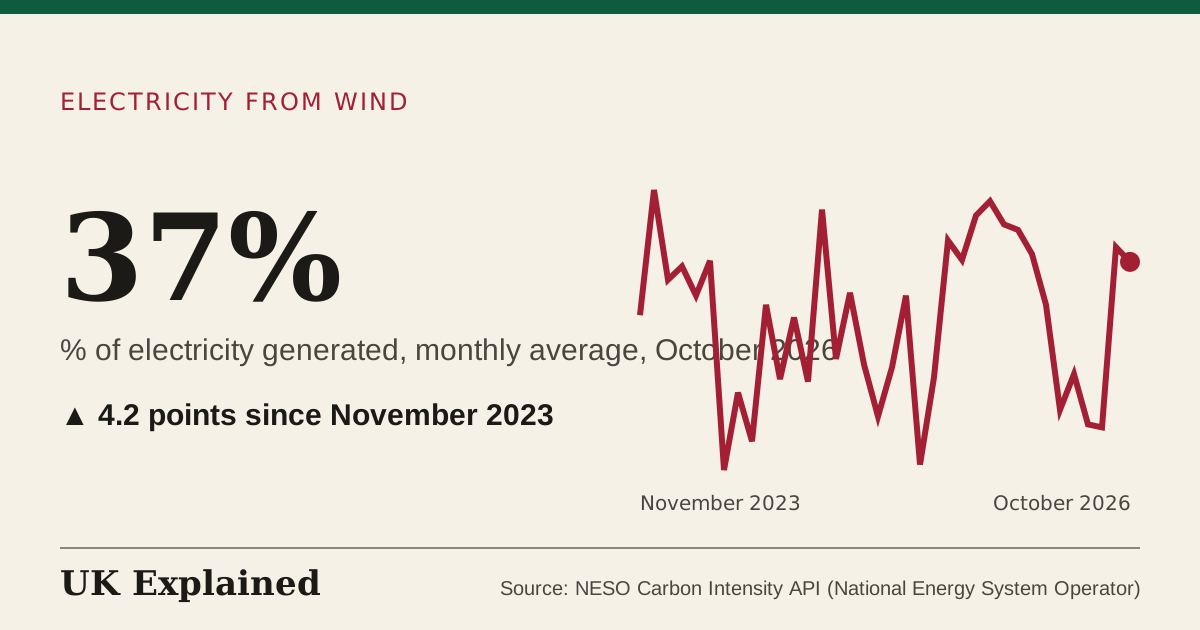
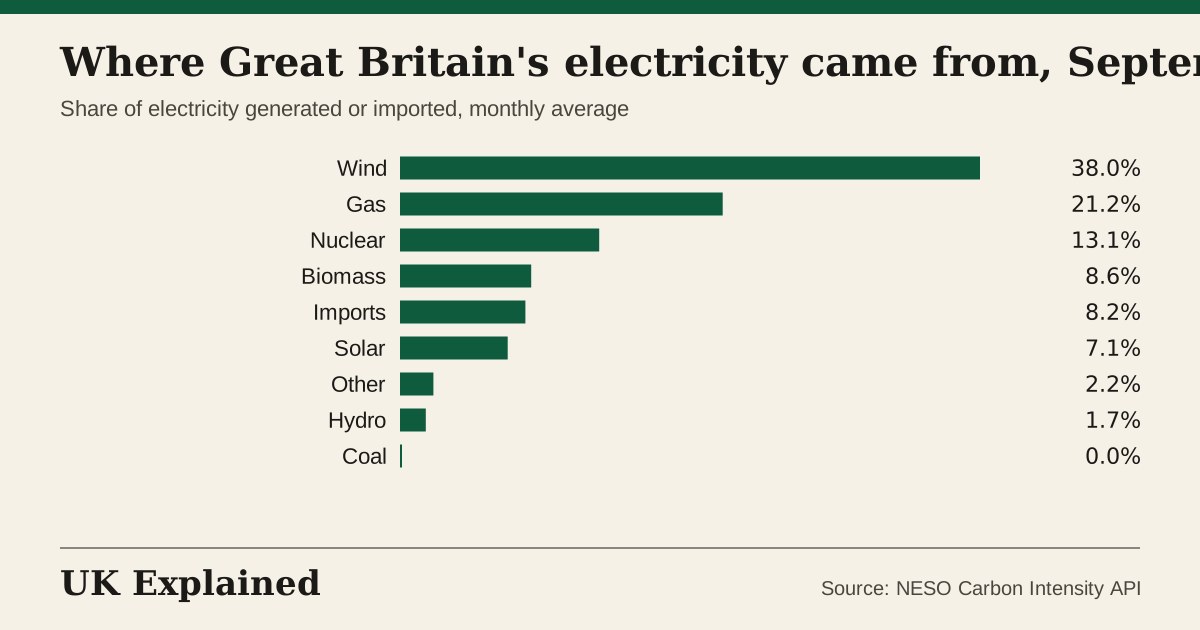
- % of electricity generated, monthly average · November 2023 to October 2026 · Source: NESO Carbon Intensity API (National Energy System Operator) · Updated 7 November 2026
- % of electricity generated, monthly average · November 2023 to October 2026 · Source: NESO Carbon Intensity API (National Energy System Operator) · Updated 7 November 2026
- % of electricity generated, monthly average · November 2023 to October 2026 · Source: NESO Carbon Intensity API (National Energy System Operator) · Updated 7 November 2026
- % of electricity generated, monthly average · November 2023 to October 2026 · Source: NESO Carbon Intensity API (National Energy System Operator) · Updated 7 November 2026
- % of electricity generated, monthly average · November 2023 to October 2026 · Source: NESO Carbon Intensity API (National Energy System Operator) · Updated 7 November 2026
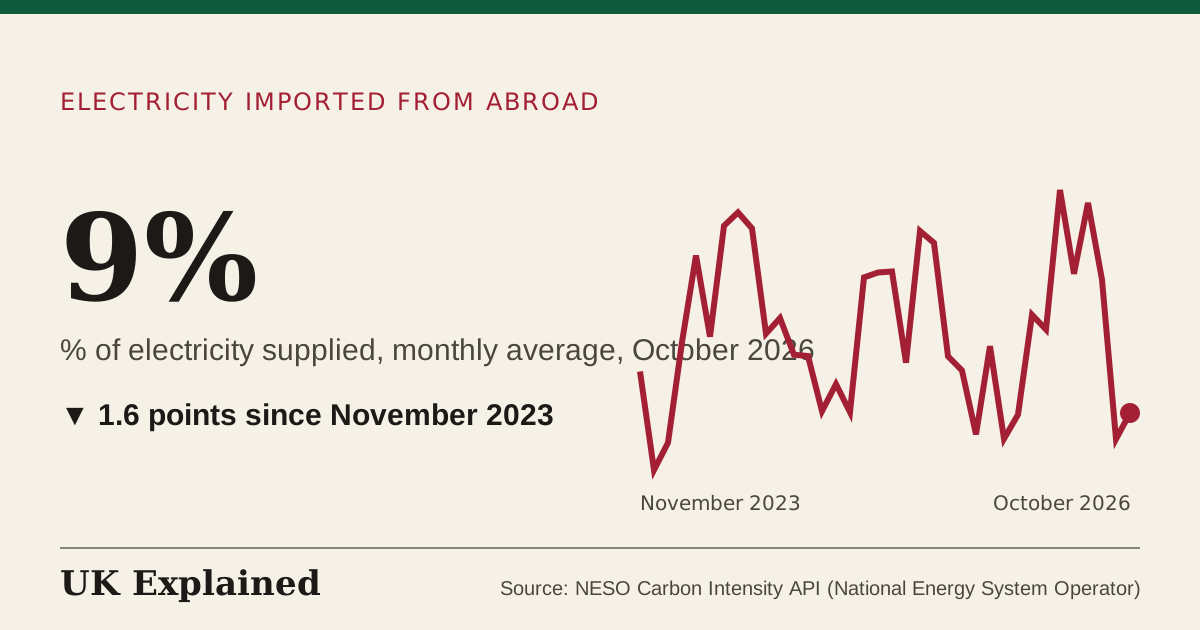
- % of electricity supplied, monthly average · November 2023 to October 2026 · Source: NESO Carbon Intensity API (National Energy System Operator) · Updated 7 November 2026
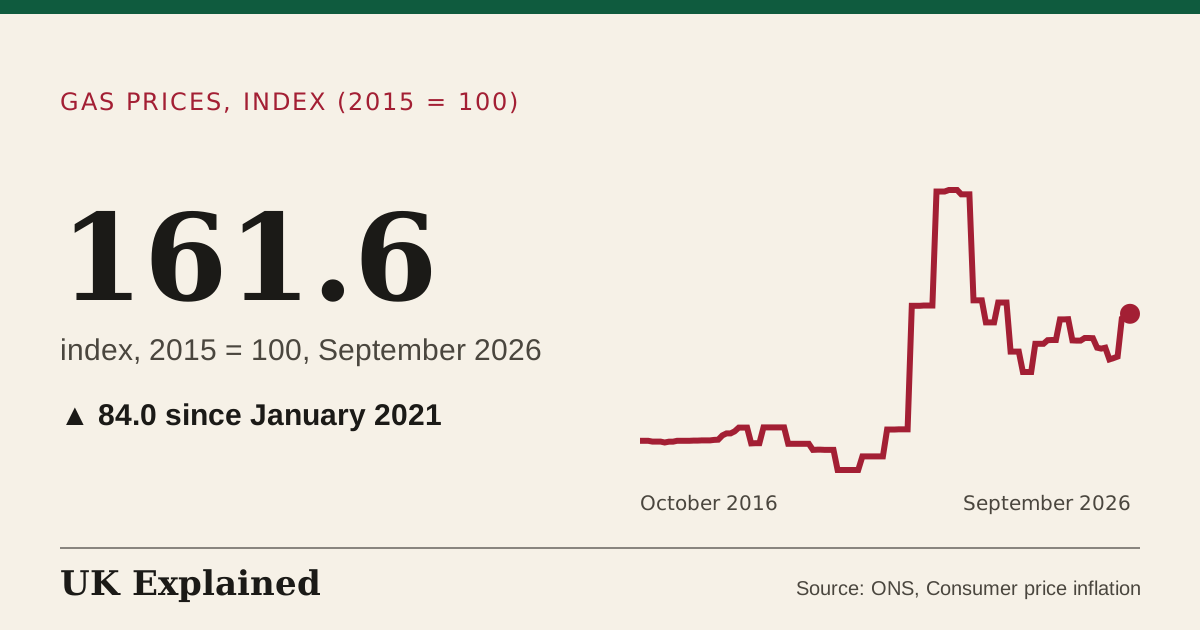
- index, 2015 = 100 · January 1988 to September 2026 · Source: ONS, Consumer price inflation · Updated 7 November 2026
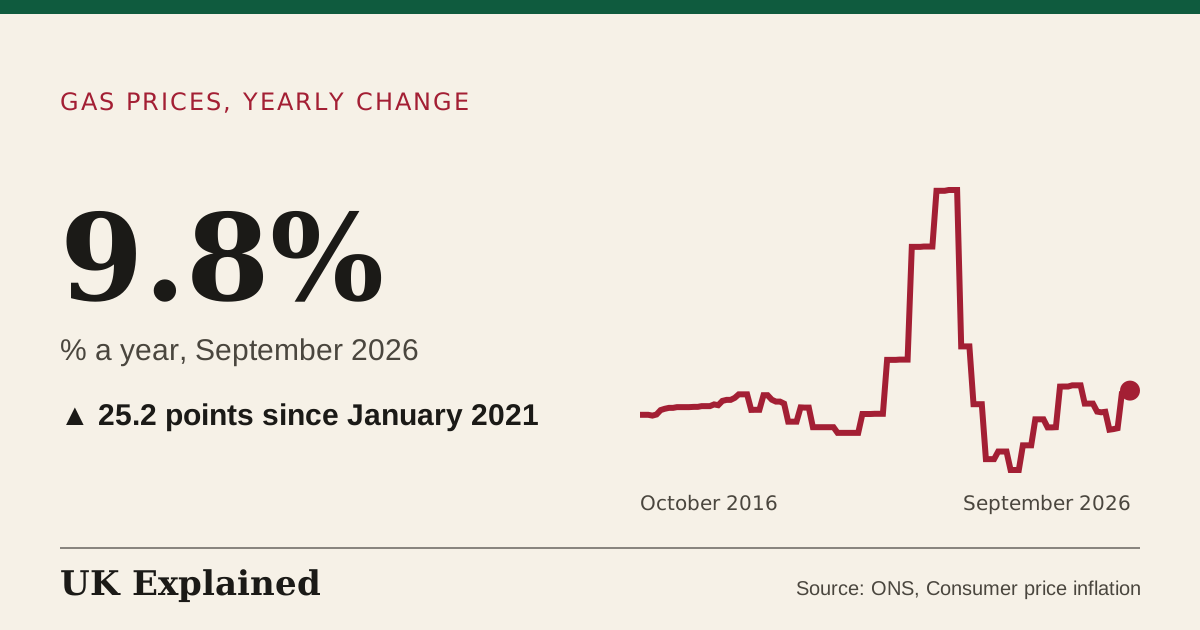
- % a year · January 1989 to September 2026 · Source: ONS, Consumer price inflation · Updated 7 November 2026
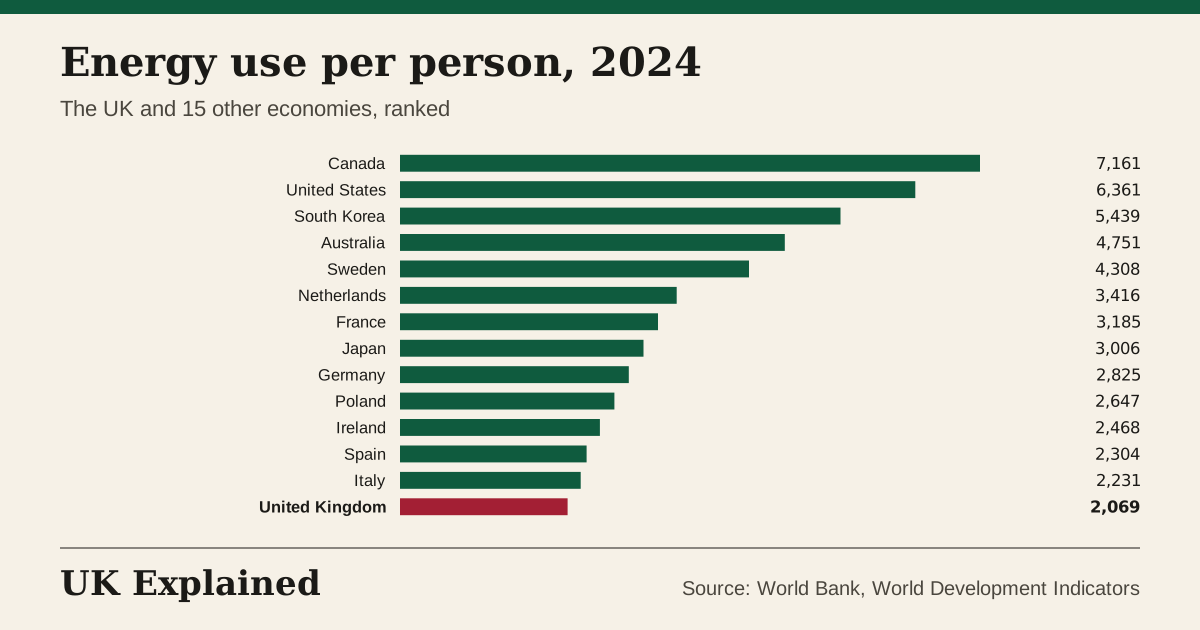
- kg of oil equivalent · 2024 · Source: World Bank, World Development Indicators · Updated 7 November 2026
- various (see the unit column) · latest year for each measure · Source: World Bank, World Development Indicators · Updated 7 November 2026
- % of electricity · 2025 · Source: World Bank, World Development Indicators · Updated 7 November 2026
- index, 2015 = 100 · January 1988 to September 2026 · Source: ONS, Consumer price inflation · Updated 7 November 2026
- % a year · January 1989 to September 2026 · Source: ONS, Consumer price inflation · Updated 7 November 2026
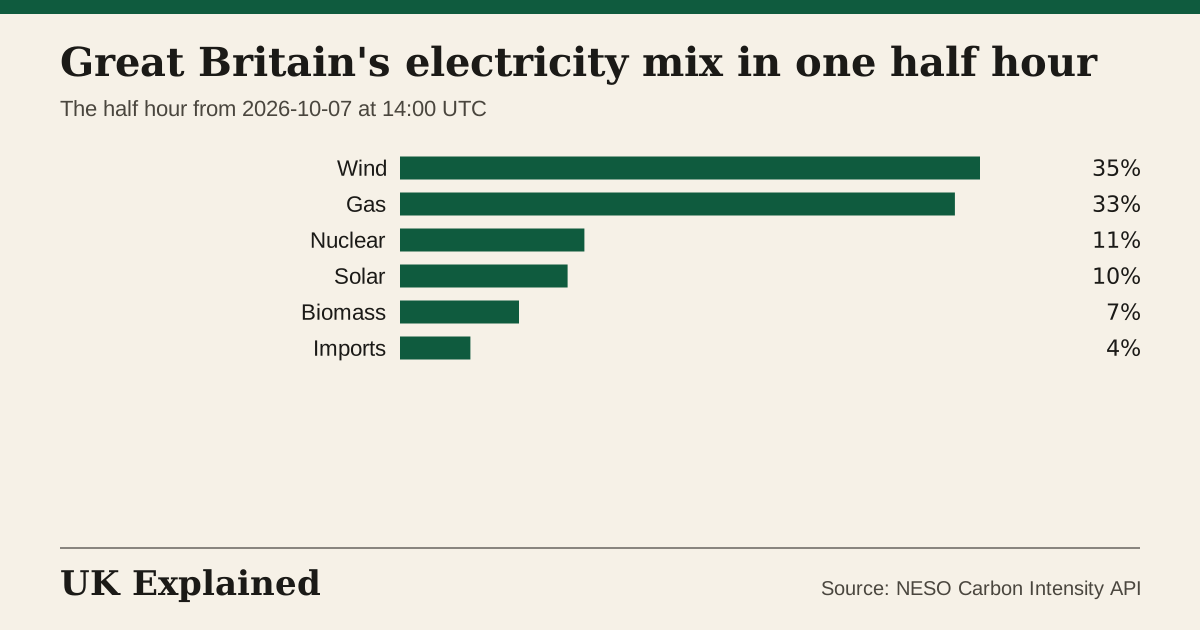
- % of electricity · half hour from 12:00 UTC on 11 November 2026 · Source: NESO Carbon Intensity API · Updated 11 November 2026
- % a year · January 1989 to September 2026 · Source: ONS, Consumer price inflation · Updated 7 November 2026
- % of energy use · 2024 · Source: World Bank, World Development Indicators · Updated 7 November 2026
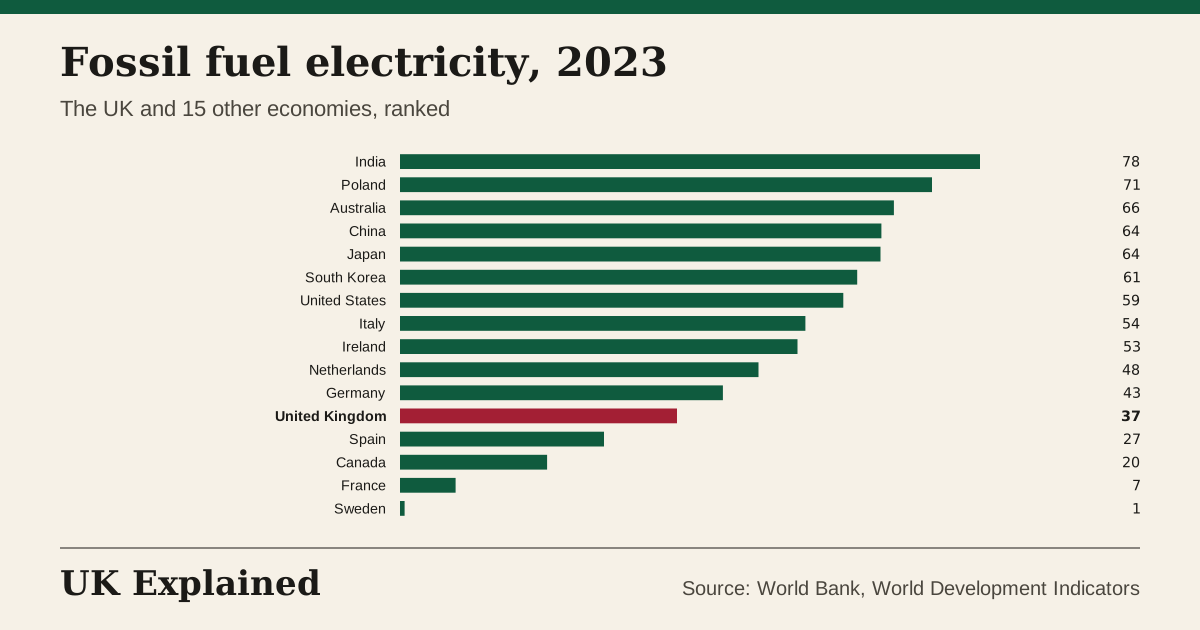
- % of electricity · 2024 · Source: World Bank, World Development Indicators · Updated 7 November 2026
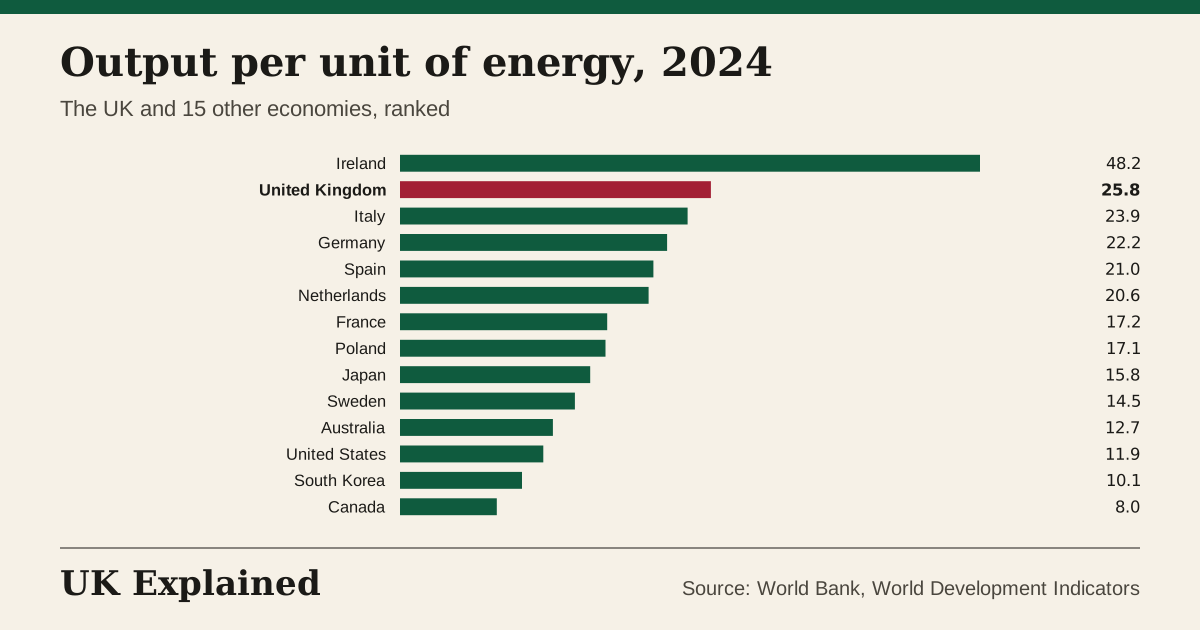
- $ of GDP per kg of oil equivalent · 2024 · Source: World Bank, World Development Indicators · Updated 7 November 2026
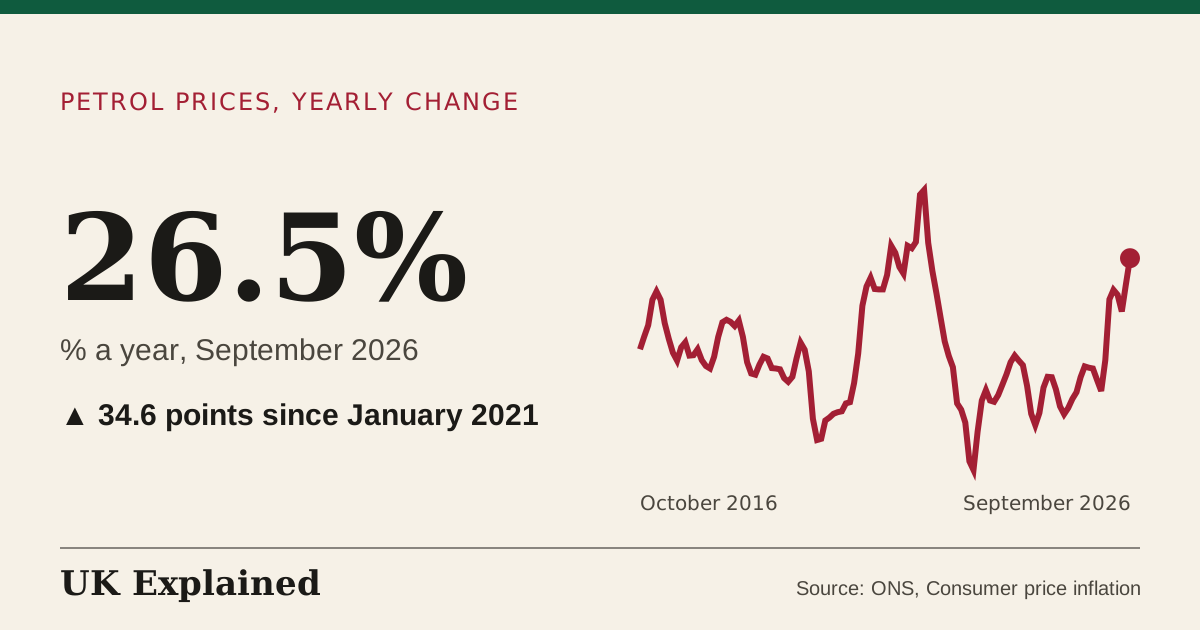
- % a year · January 2016 to September 2026 · Source: ONS, Consumer price inflation · Updated 7 November 2026
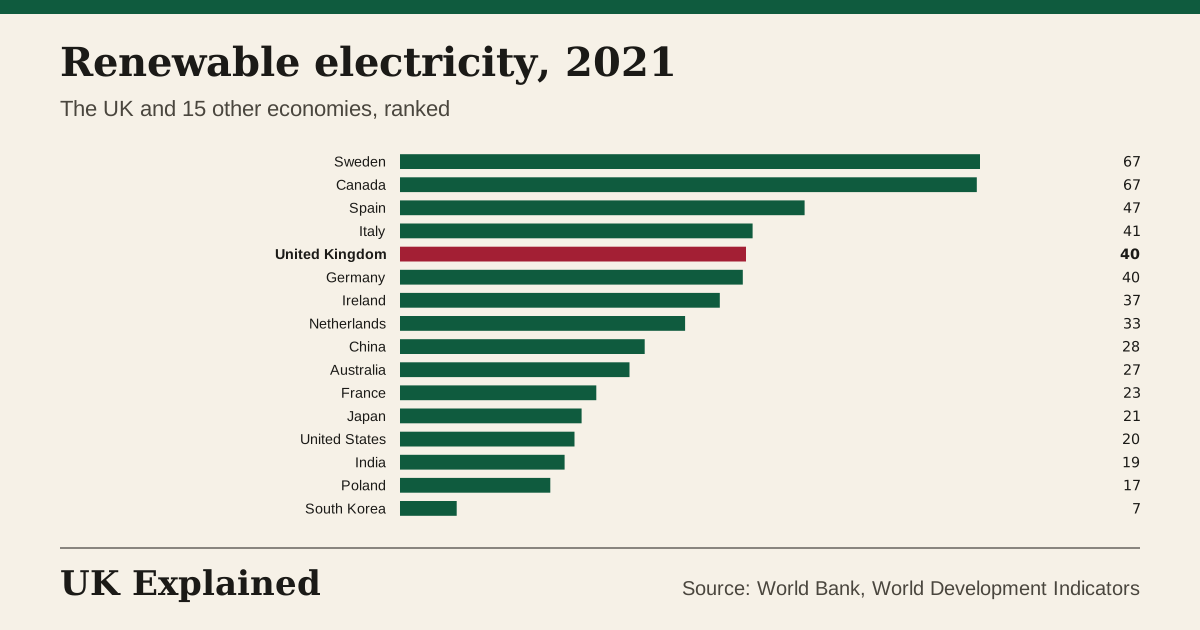
- % of electricity · 2021 · Source: World Bank, World Development Indicators · Updated 7 November 2026
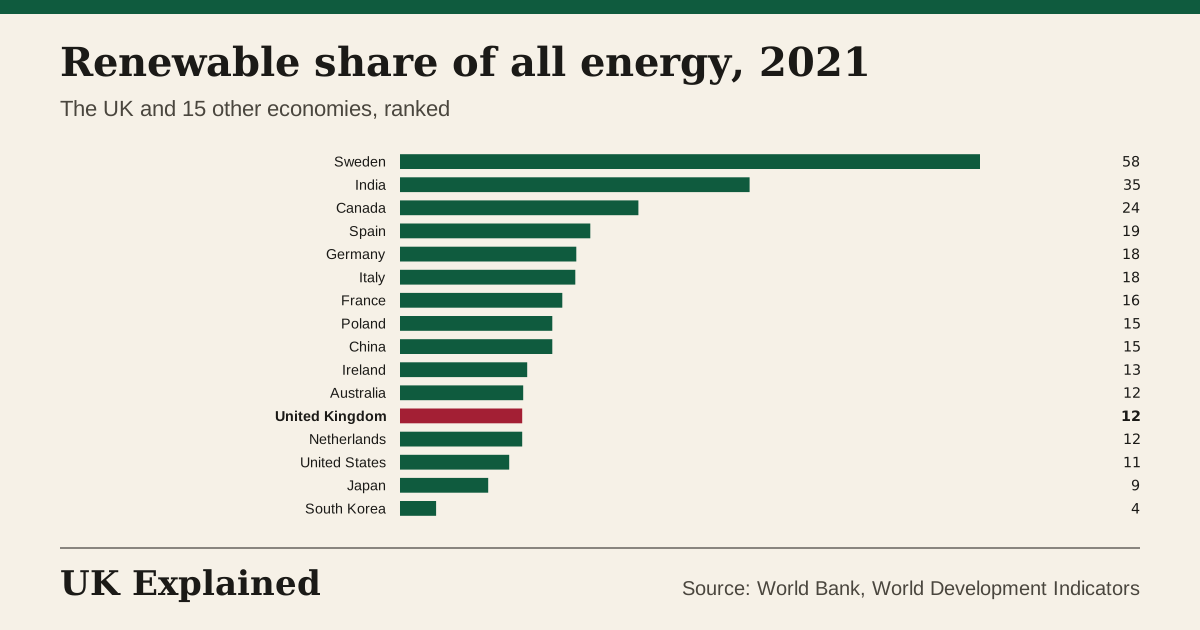
- % of final energy · 2021 · Source: World Bank, World Development Indicators · Updated 7 November 2026
- % of electricity · October 2026 · Source: NESO Carbon Intensity API · Updated 7 November 2026
People
(24)
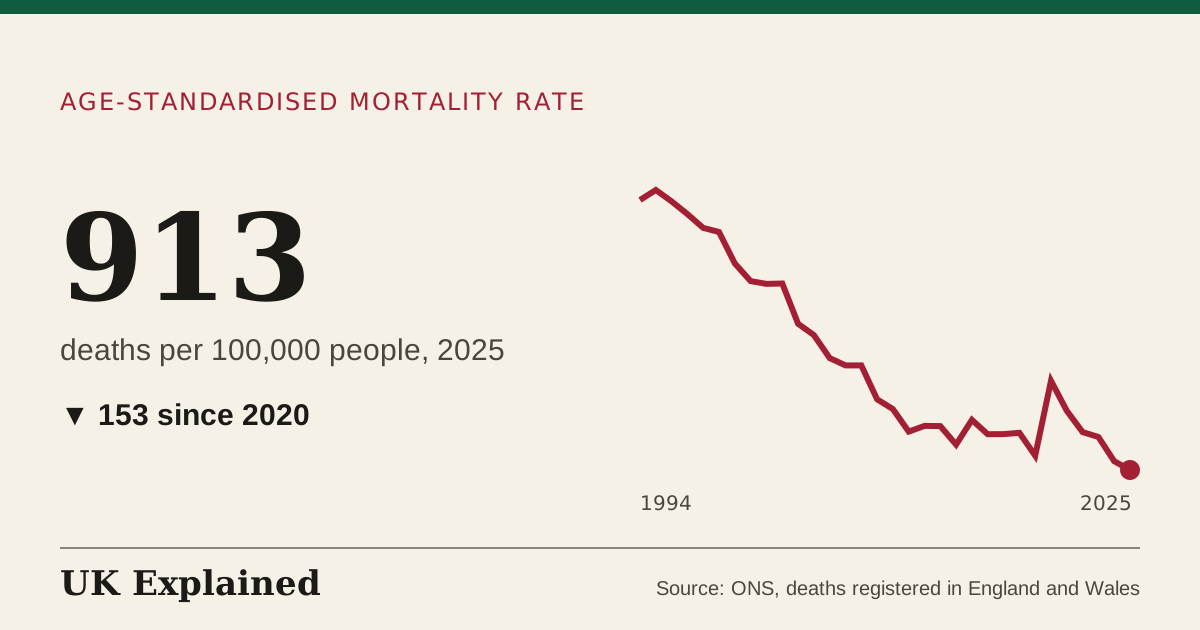
- deaths per 100,000 people · 1994 to 2025 · Source: ONS, deaths registered in England and Wales · Updated 7 November 2026
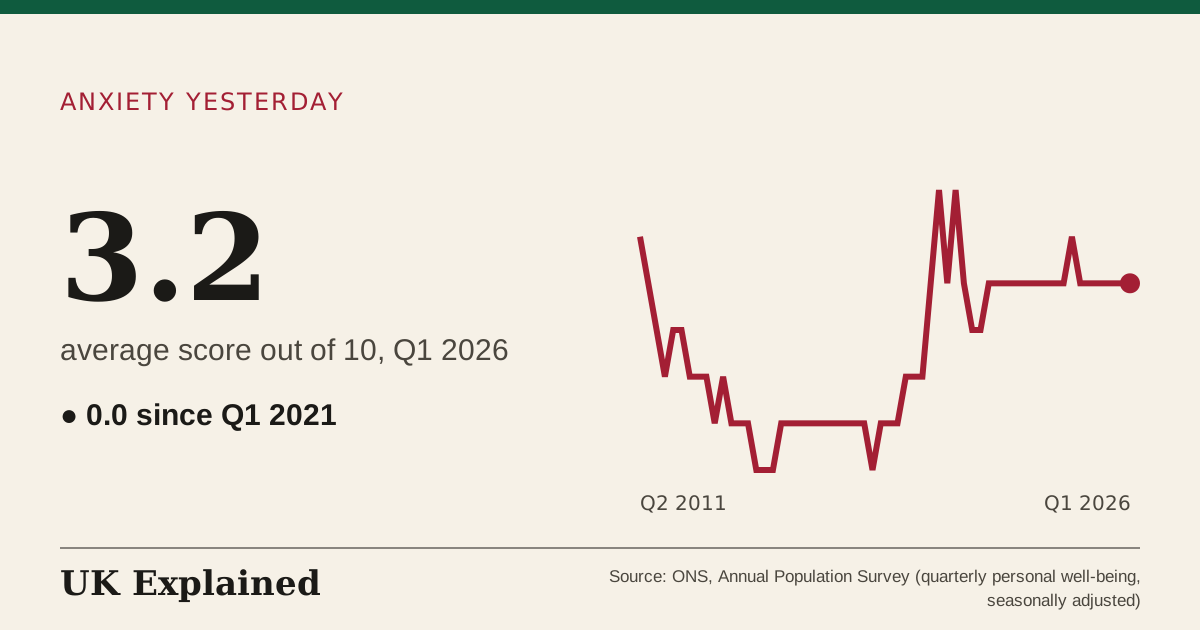
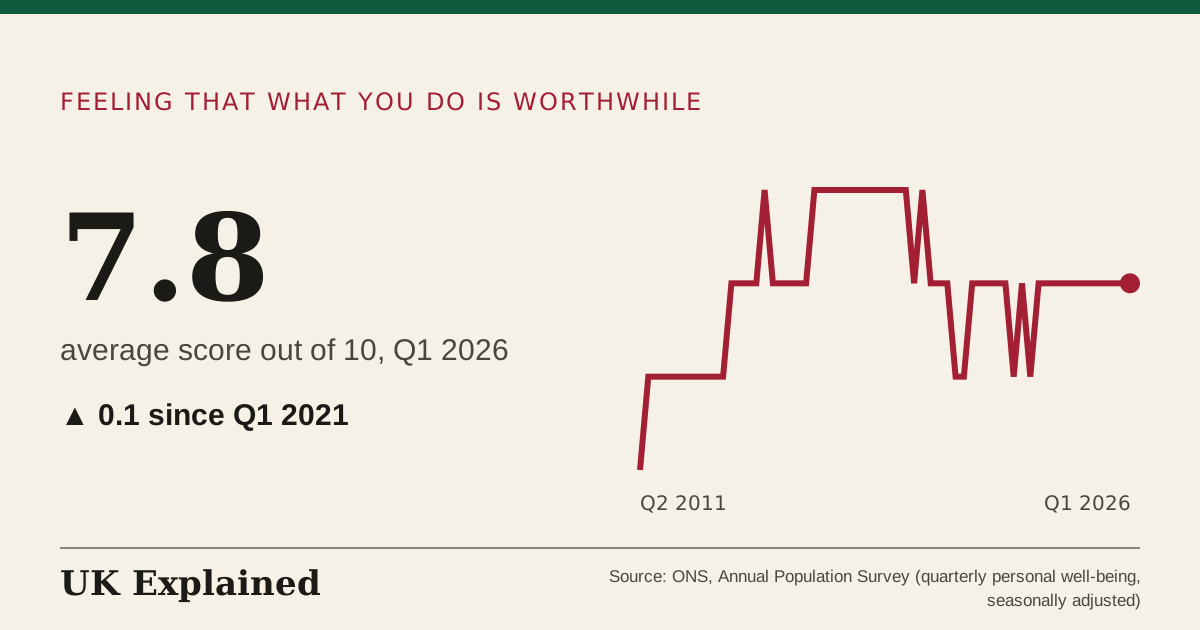
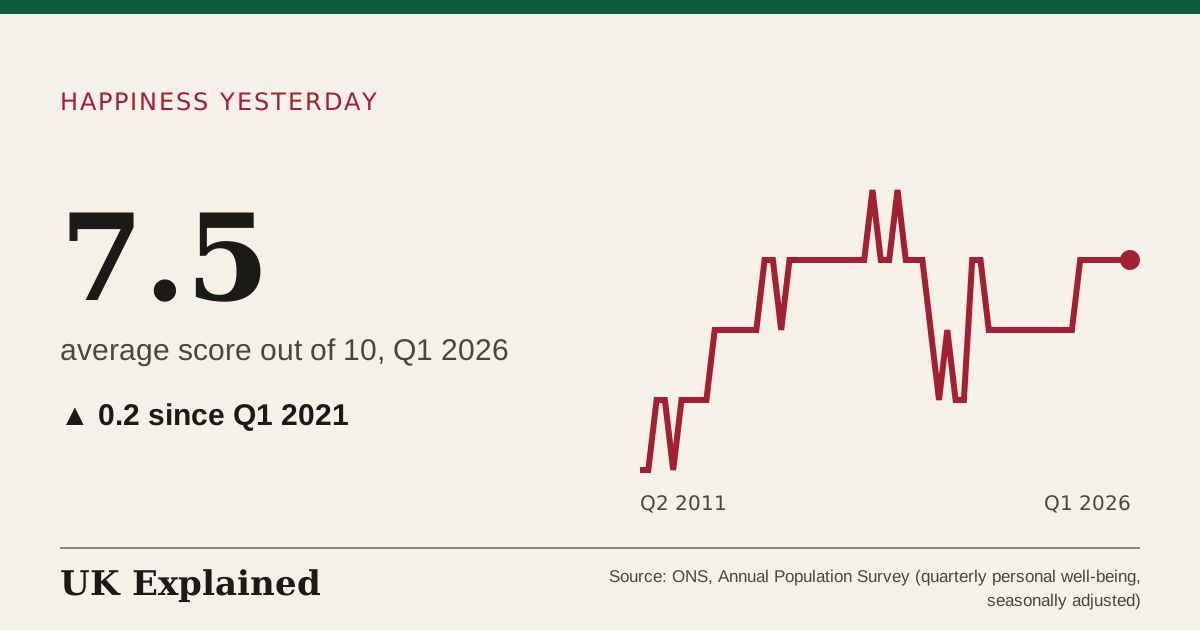
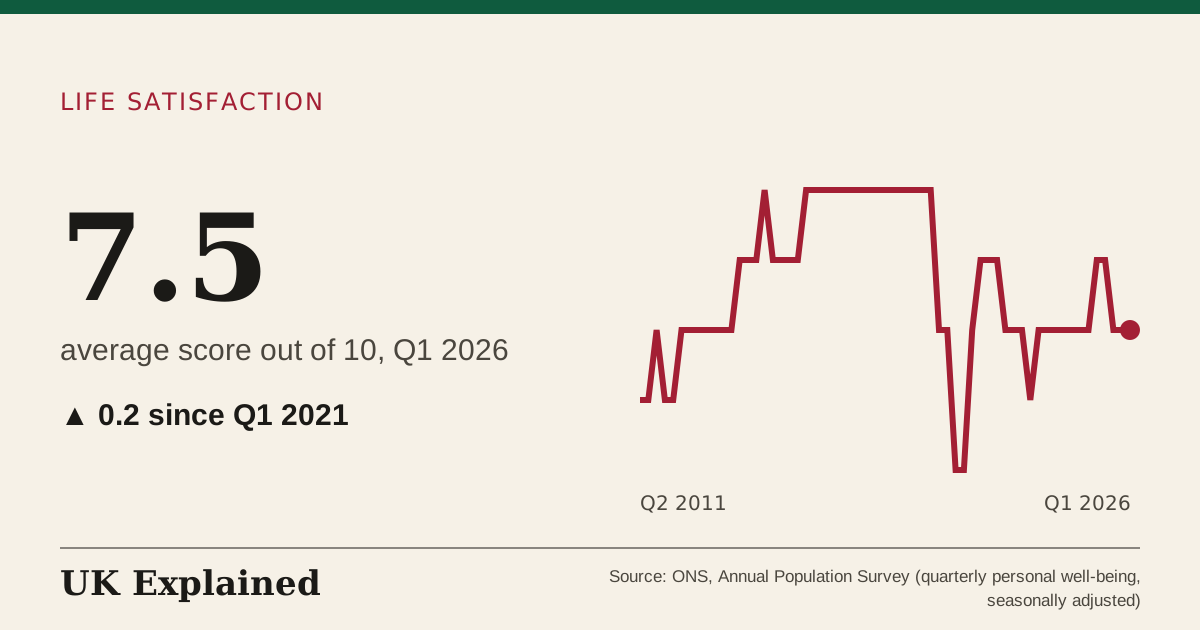
- average score out of 10 · Q2 2011 to Q1 2026 · Source: ONS, Annual Population Survey (quarterly personal well-being, seasonally adjusted) · Updated 7 November 2026
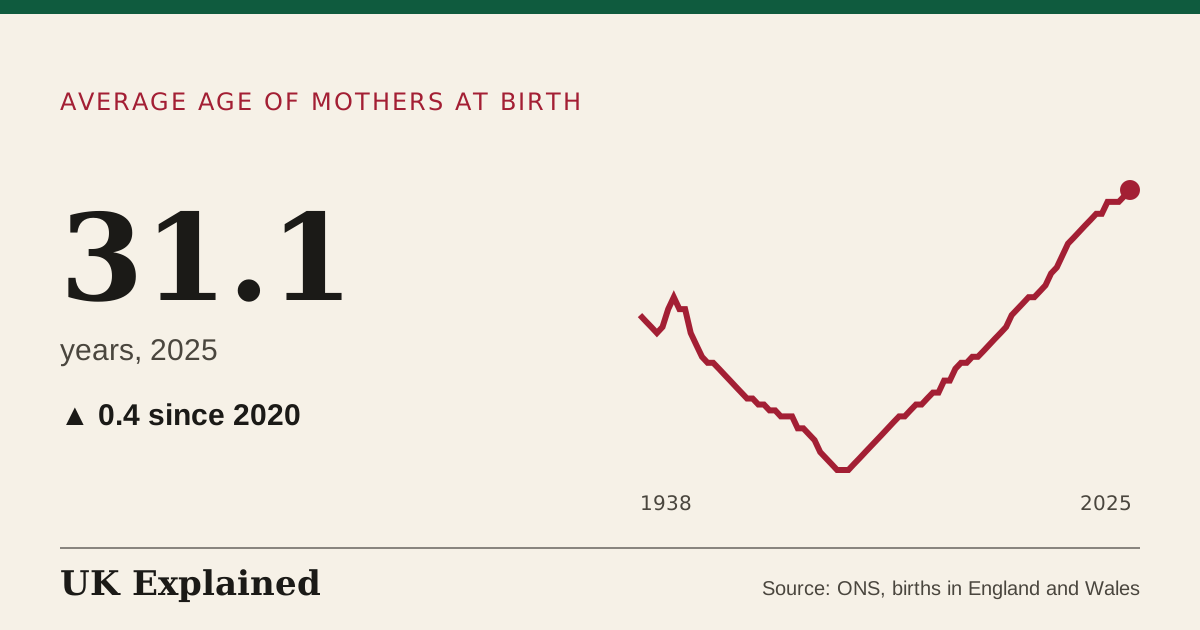
- years · 1938 to 2025 · Source: ONS, births in England and Wales · Updated 7 November 2026
- deaths registered in the year · 1900 to 2025 · Source: ONS, deaths registered in England and Wales · Updated 7 November 2026
- average score out of 10 · Q2 2011 to Q1 2026 · Source: ONS, Annual Population Survey (quarterly personal well-being, seasonally adjusted) · Updated 7 November 2026
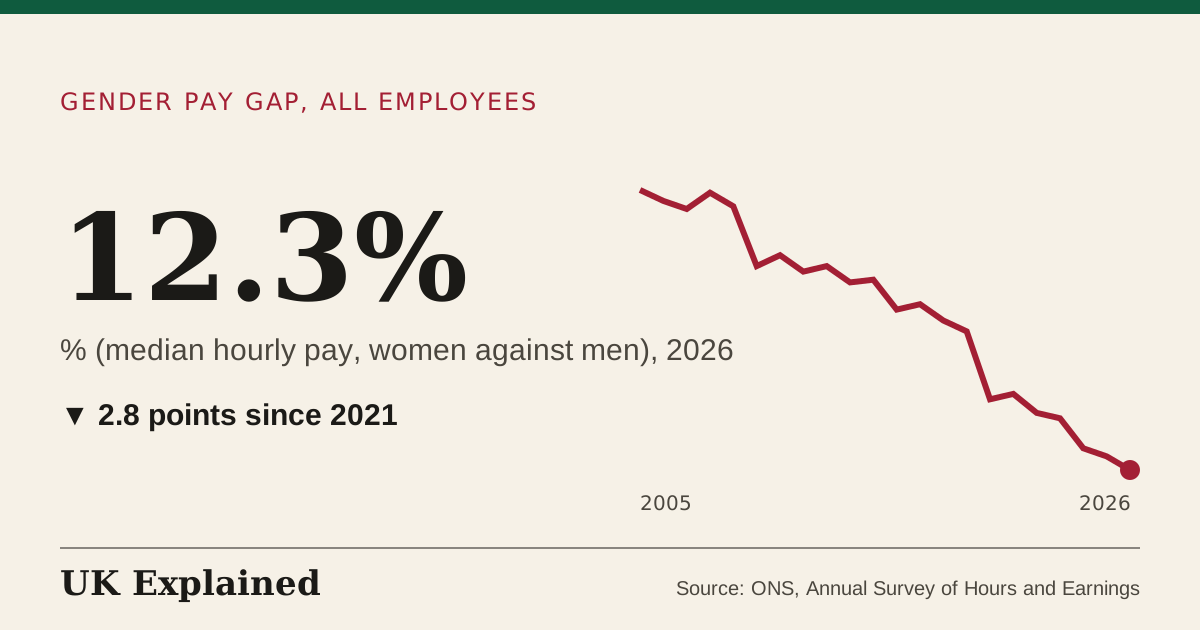
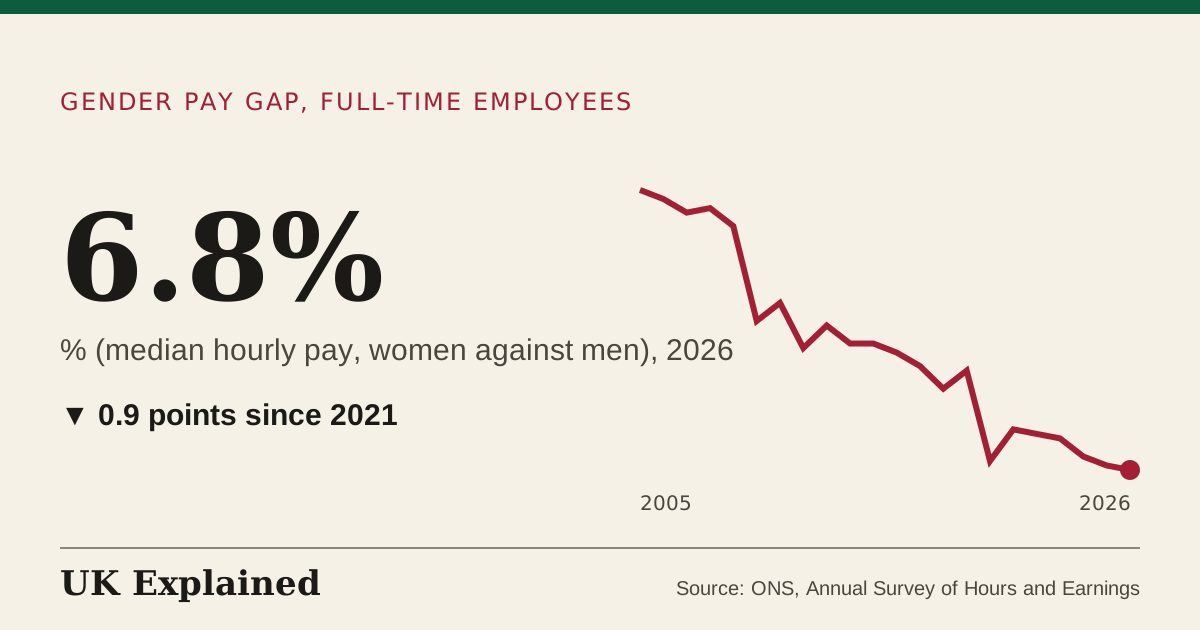
- % (median hourly pay, women against men) · 2005 to 2026 · Source: ONS, Annual Survey of Hours and Earnings · Updated 7 November 2026
- % (median hourly pay, women against men) · 2005 to 2026 · Source: ONS, Annual Survey of Hours and Earnings · Updated 7 November 2026
- average score out of 10 · Q2 2011 to Q1 2026 · Source: ONS, Annual Population Survey (quarterly personal well-being, seasonally adjusted) · Updated 7 November 2026
- average score out of 10 · Q2 2011 to Q1 2026 · Source: ONS, Annual Population Survey (quarterly personal well-being, seasonally adjusted) · Updated 7 November 2026
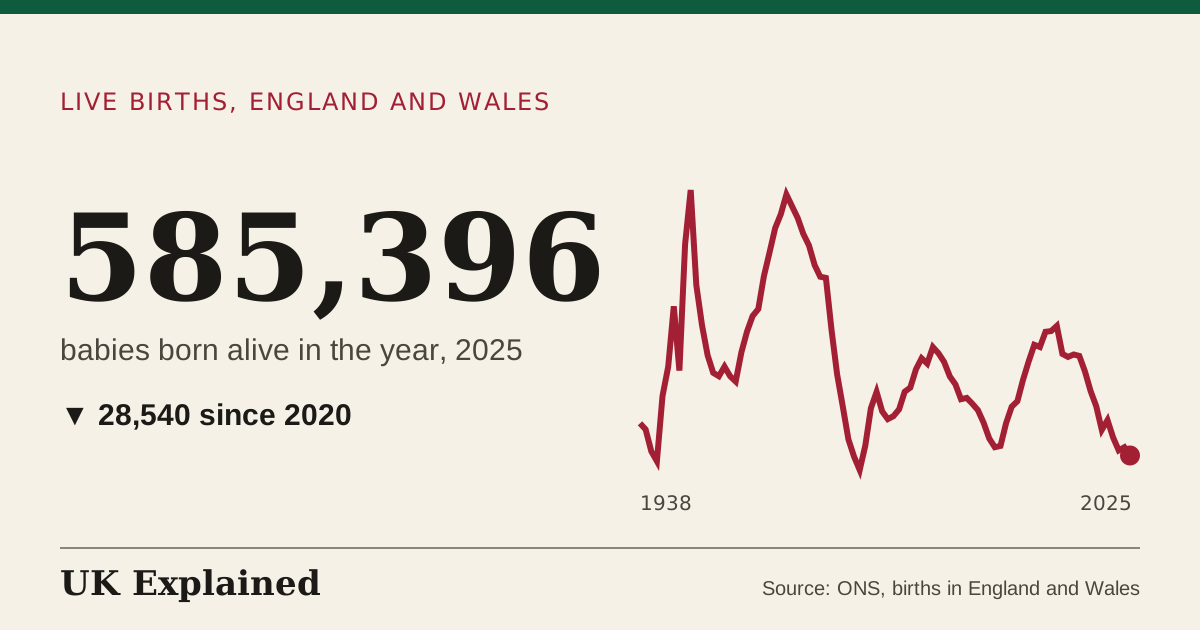
- babies born alive in the year · 1938 to 2025 · Source: ONS, births in England and Wales · Updated 7 November 2026
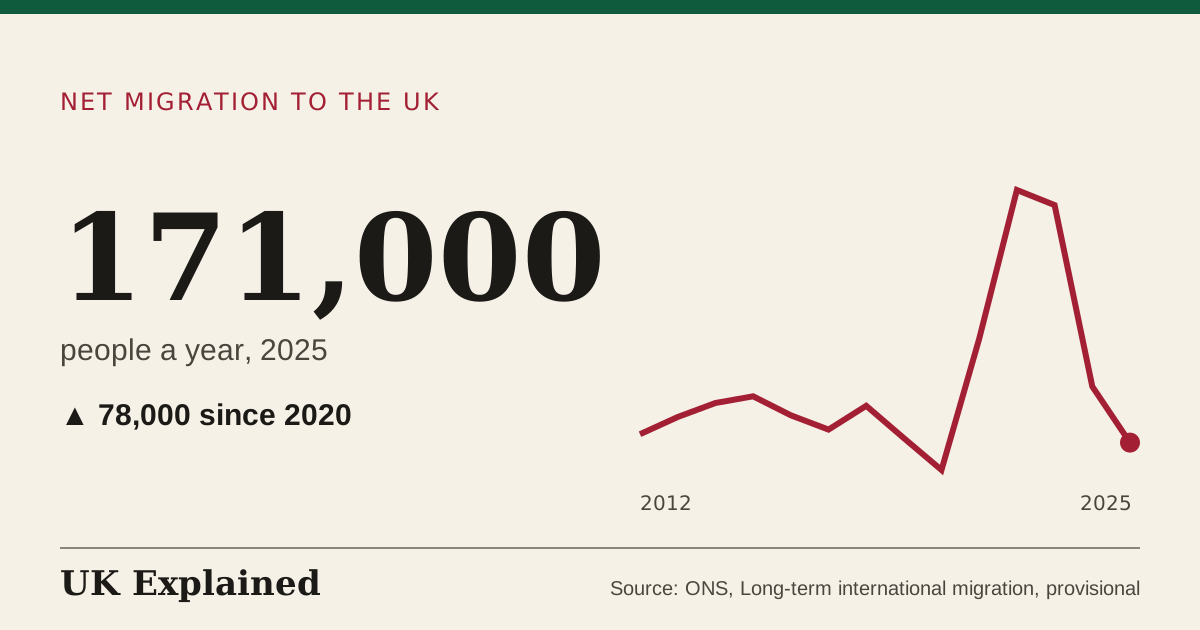
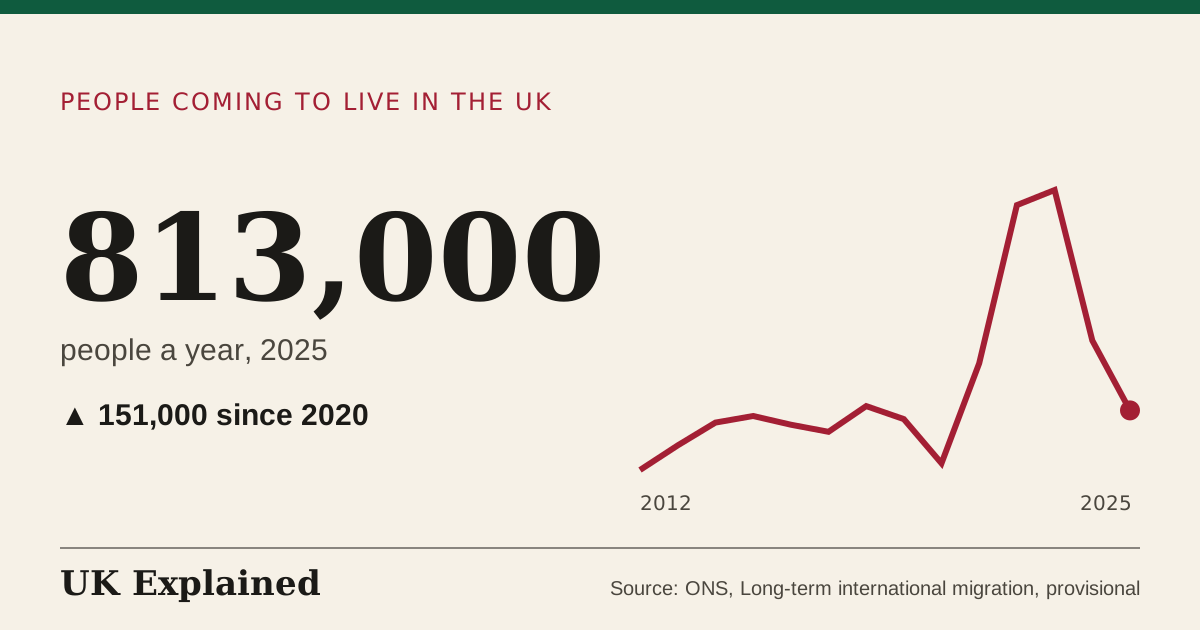
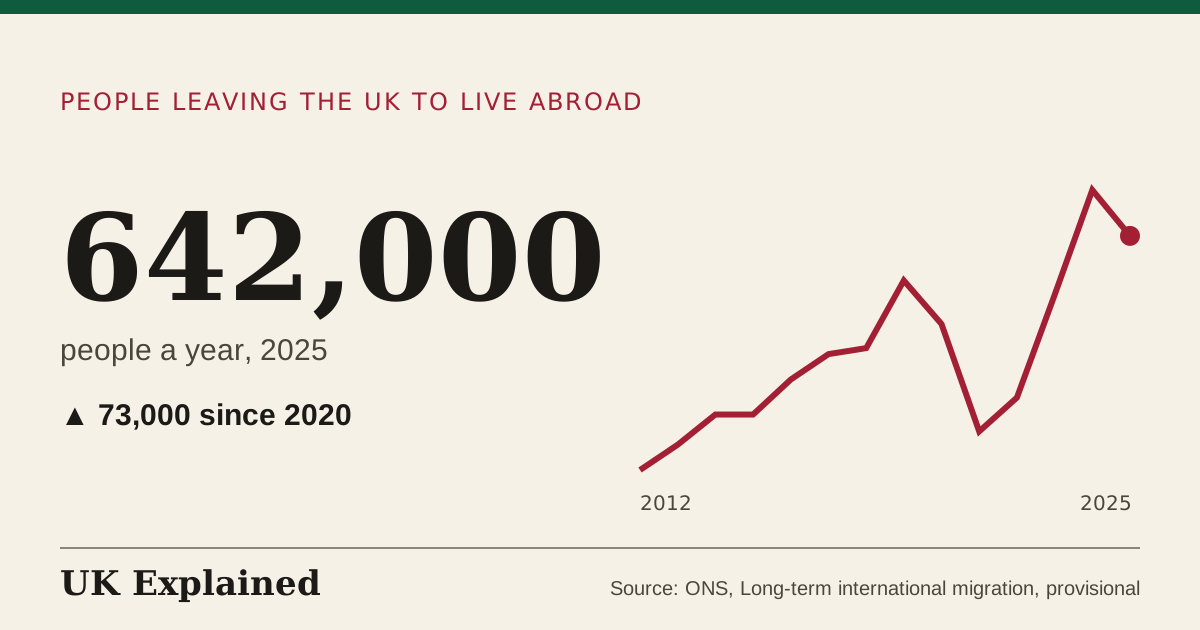
- people a year · 2012 to 2025 · Source: ONS, Long-term international migration, provisional · Updated 7 November 2026
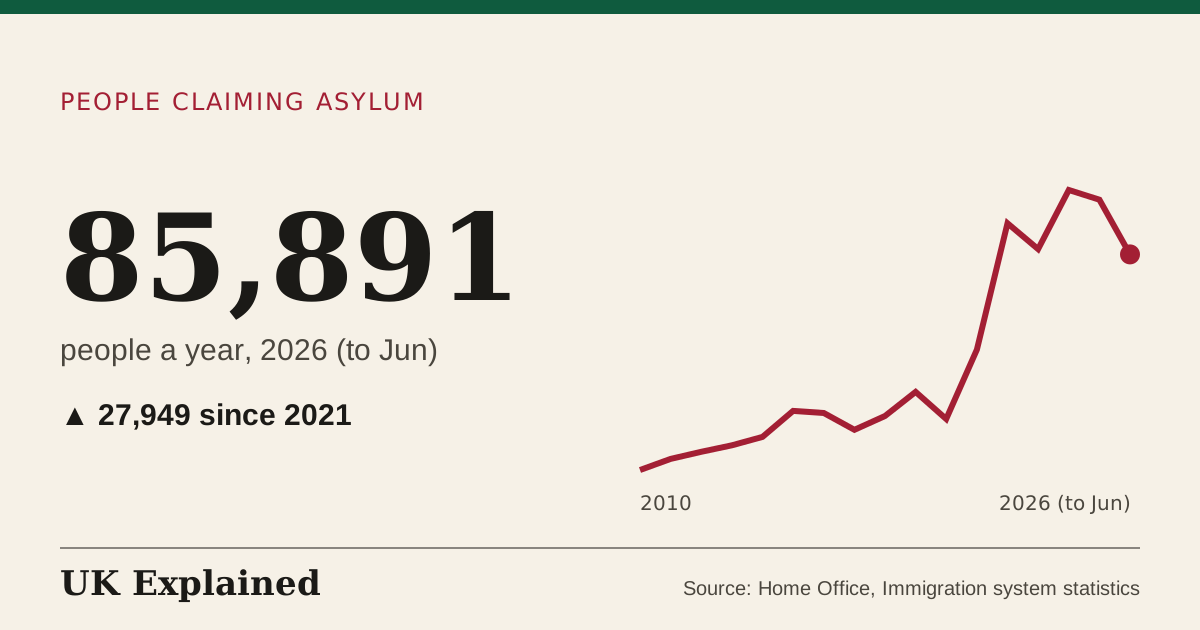
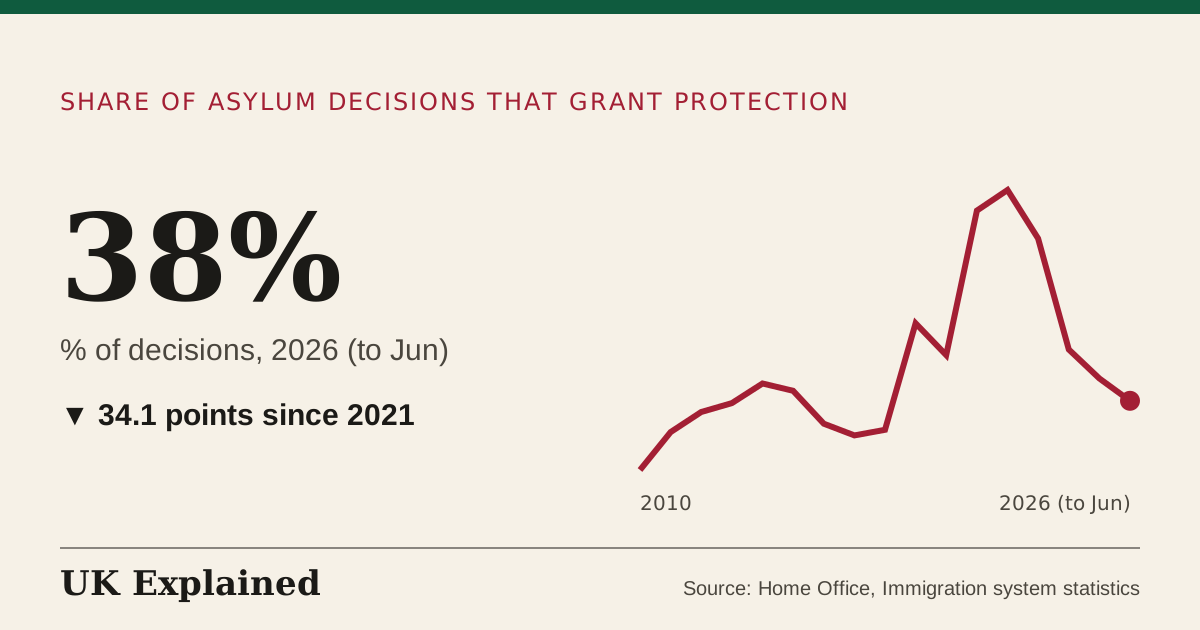
- people a year · 2010 to 2026 (to Jun) · Source: Home Office, Immigration system statistics · Updated 7 November 2026
- people a year · 2012 to 2025 · Source: ONS, Long-term international migration, provisional · Updated 7 November 2026
- people a year · 2012 to 2025 · Source: ONS, Long-term international migration, provisional · Updated 7 November 2026
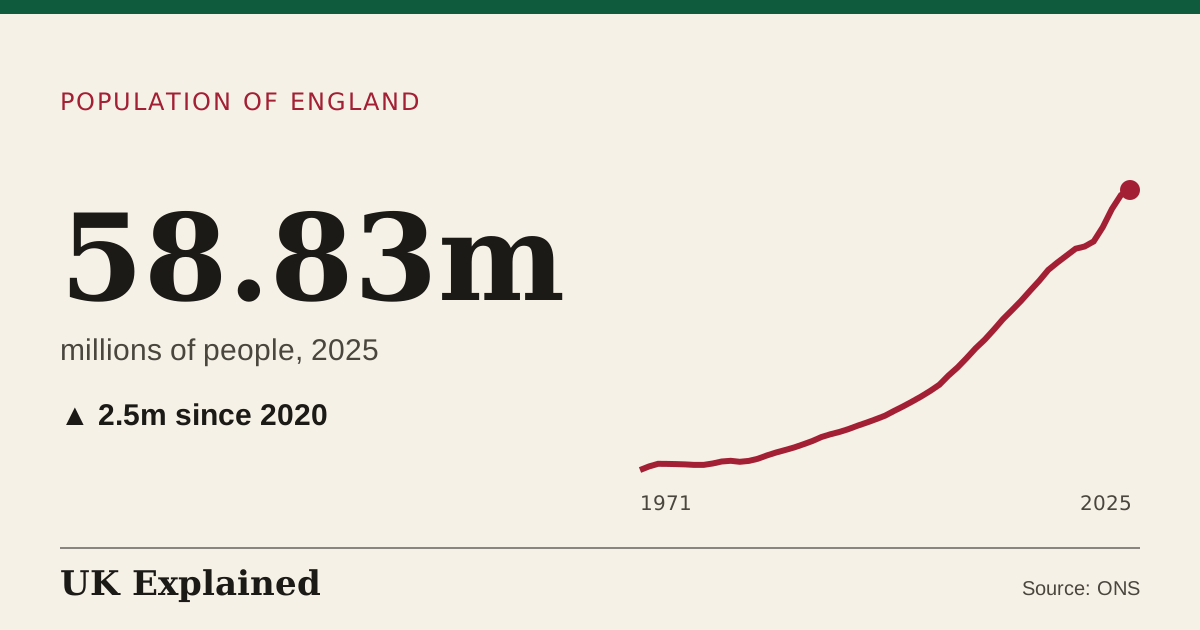
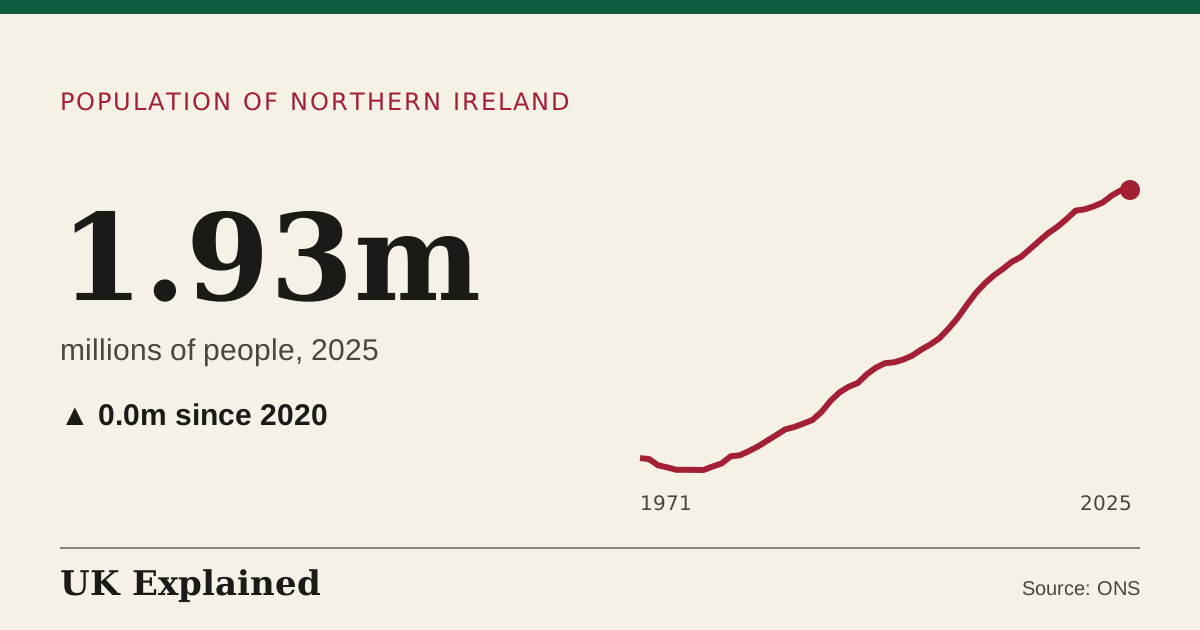
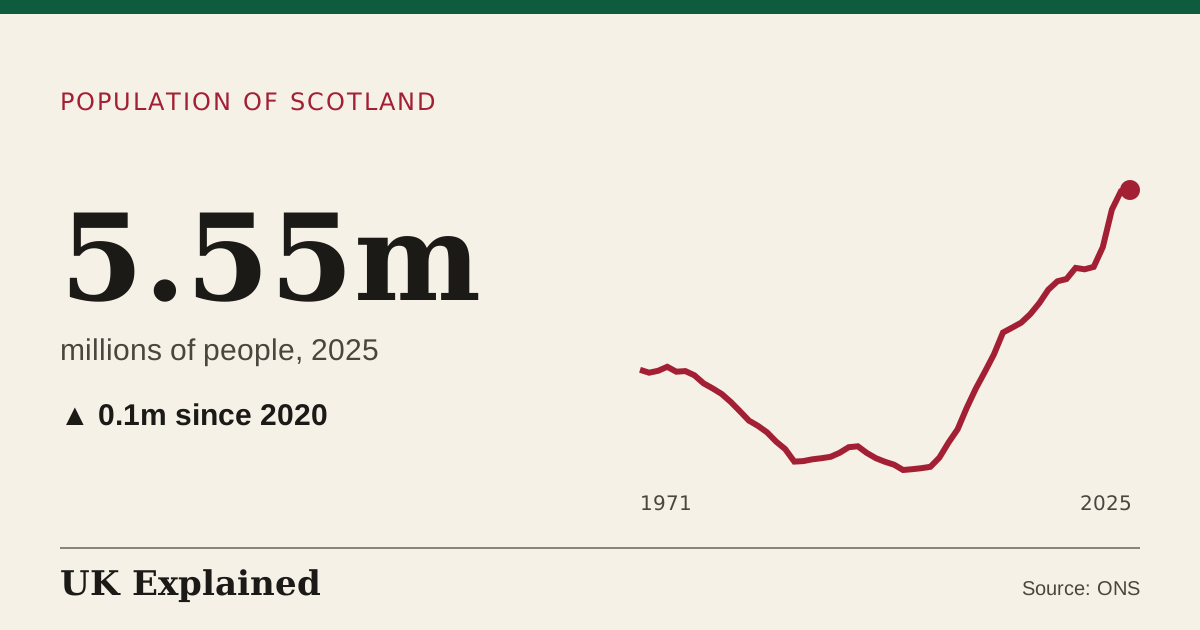
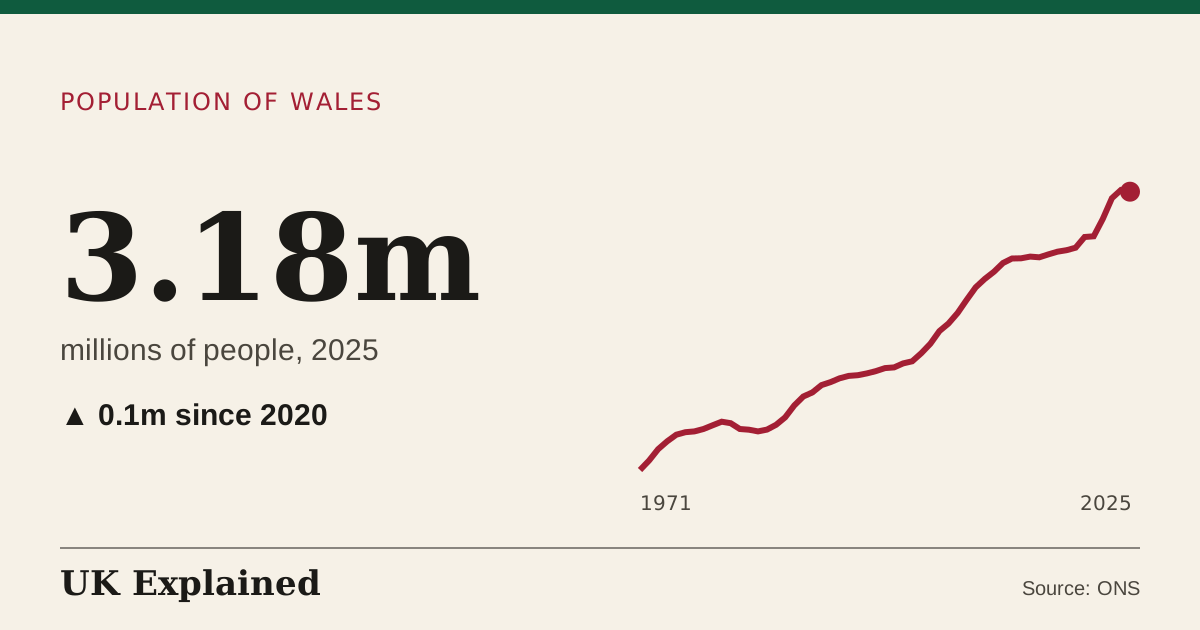
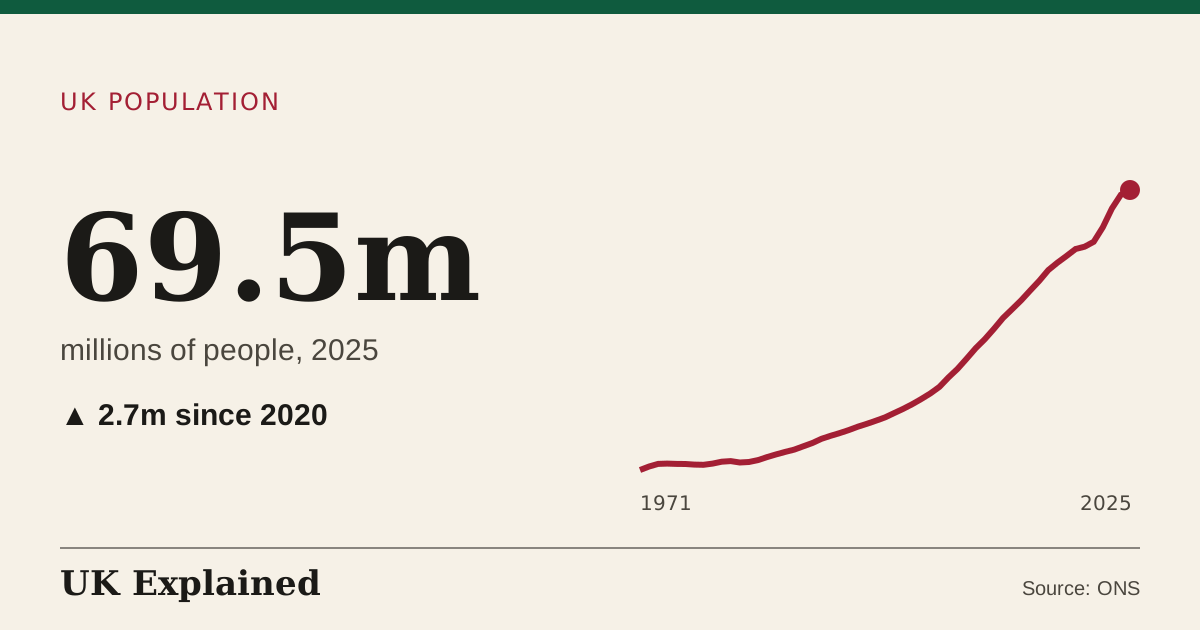
- millions of people · 1971 to 2025 · Source: ONS · Updated 7 November 2026
- millions of people · 1971 to 2025 · Source: ONS · Updated 7 November 2026
- millions of people · 1971 to 2025 · Source: ONS · Updated 7 November 2026
- millions of people · 1971 to 2025 · Source: ONS · Updated 7 November 2026
- % of decisions · 2010 to 2026 (to Jun) · Source: Home Office, Immigration system statistics · Updated 7 November 2026
- millions of people · 1971 to 2025 · Source: ONS · Updated 7 November 2026
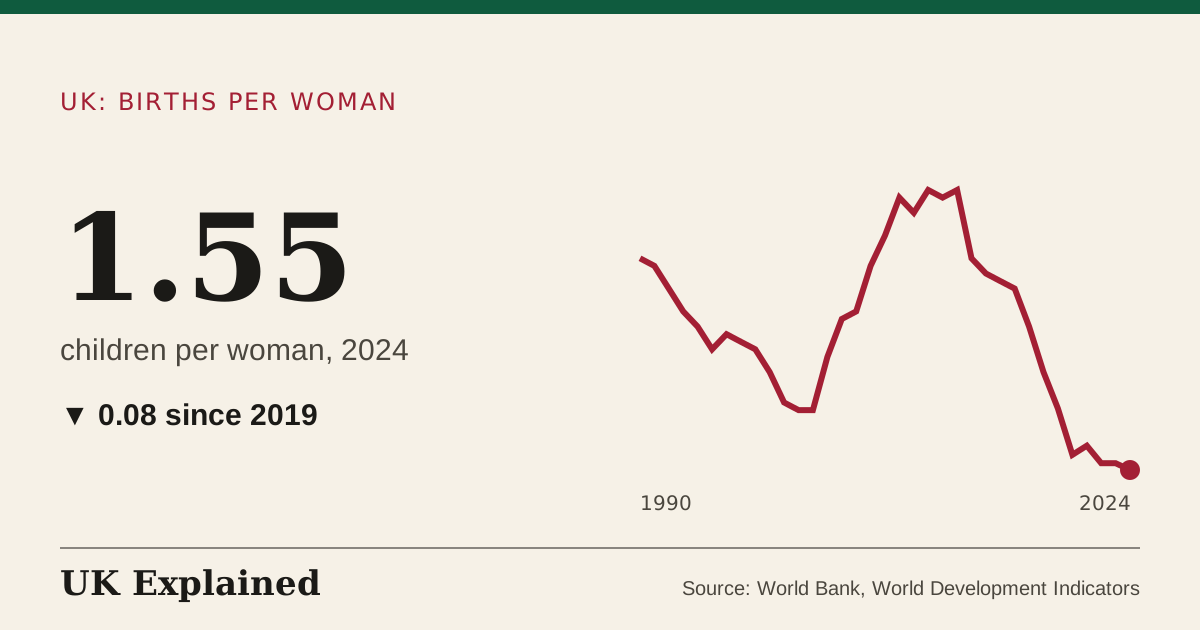
- children per woman · 1990 to 2024 · Source: World Bank, World Development Indicators · Updated 7 November 2026
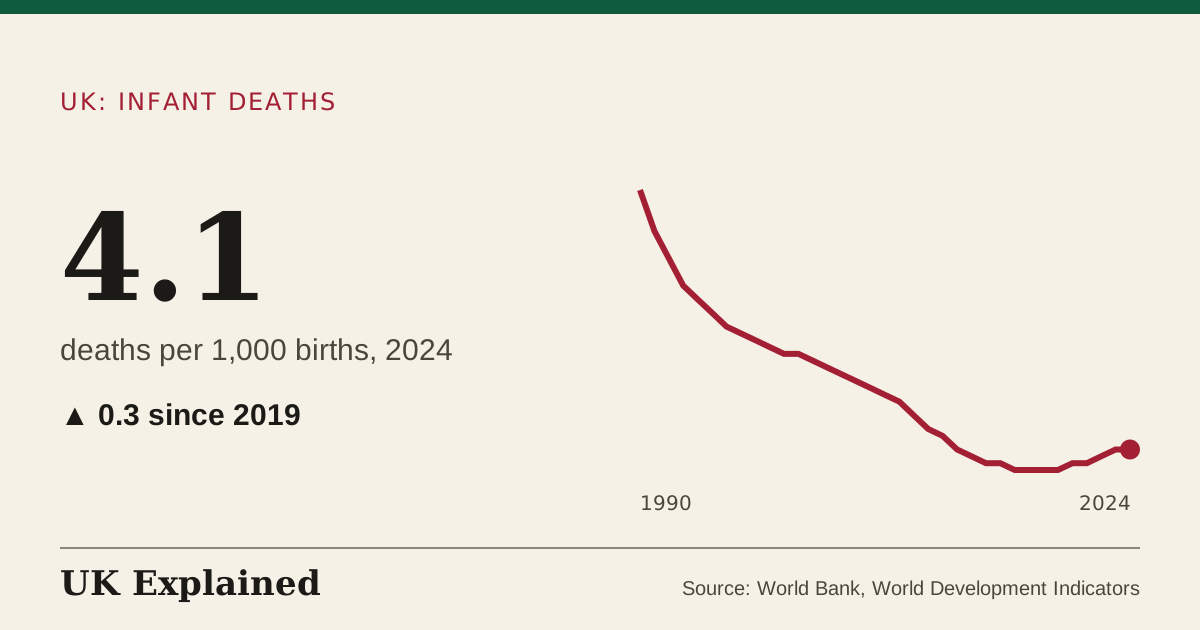
- deaths per 1,000 births · 1990 to 2024 · Source: World Bank, World Development Indicators · Updated 7 November 2026
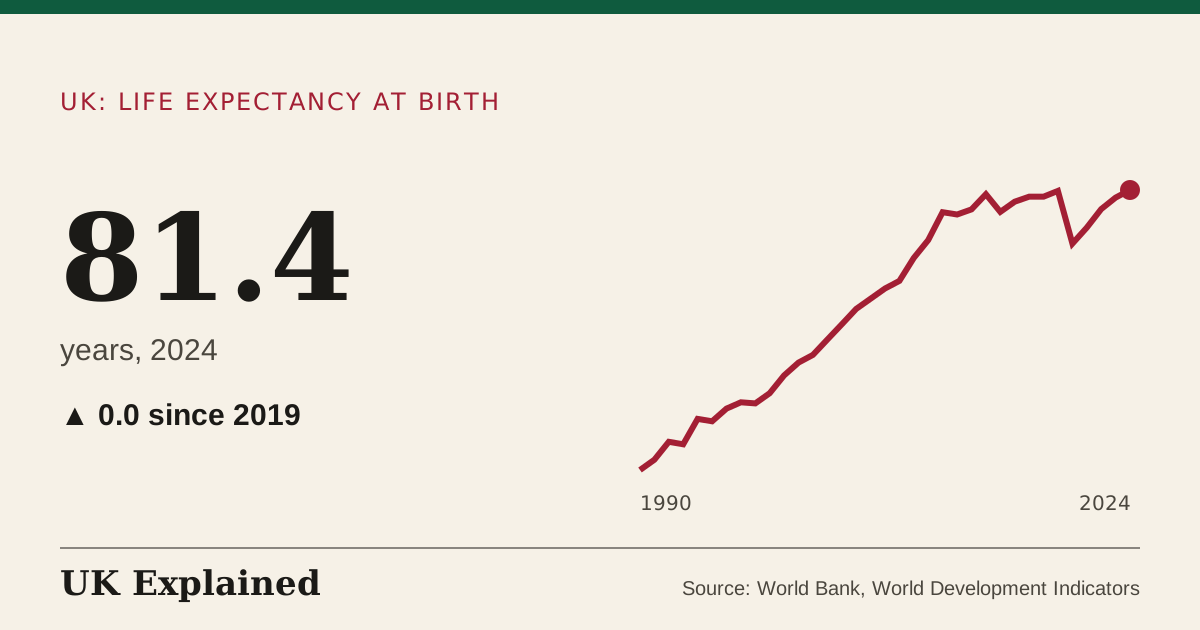
- years · 1990 to 2024 · Source: World Bank, World Development Indicators · Updated 7 November 2026
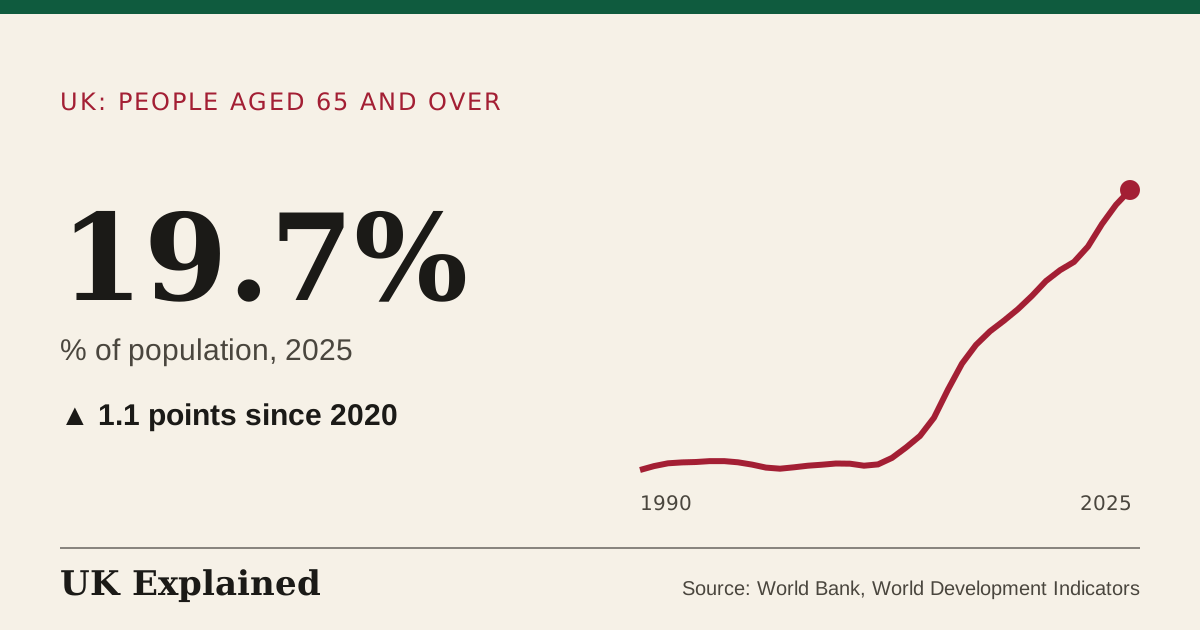
- % of population · 1990 to 2025 · Source: World Bank, World Development Indicators · Updated 7 November 2026

Education
(15)
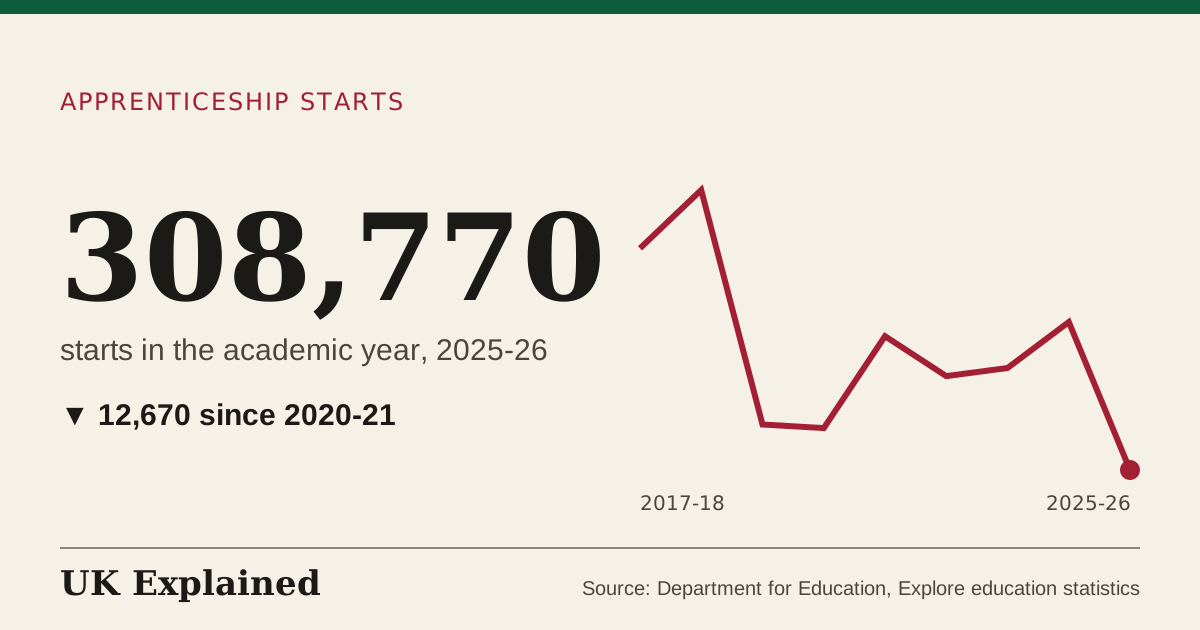
- starts in the academic year · 2017–18 to 2025–26 · Source: Department for Education, Explore education statistics · Updated 7 November 2026
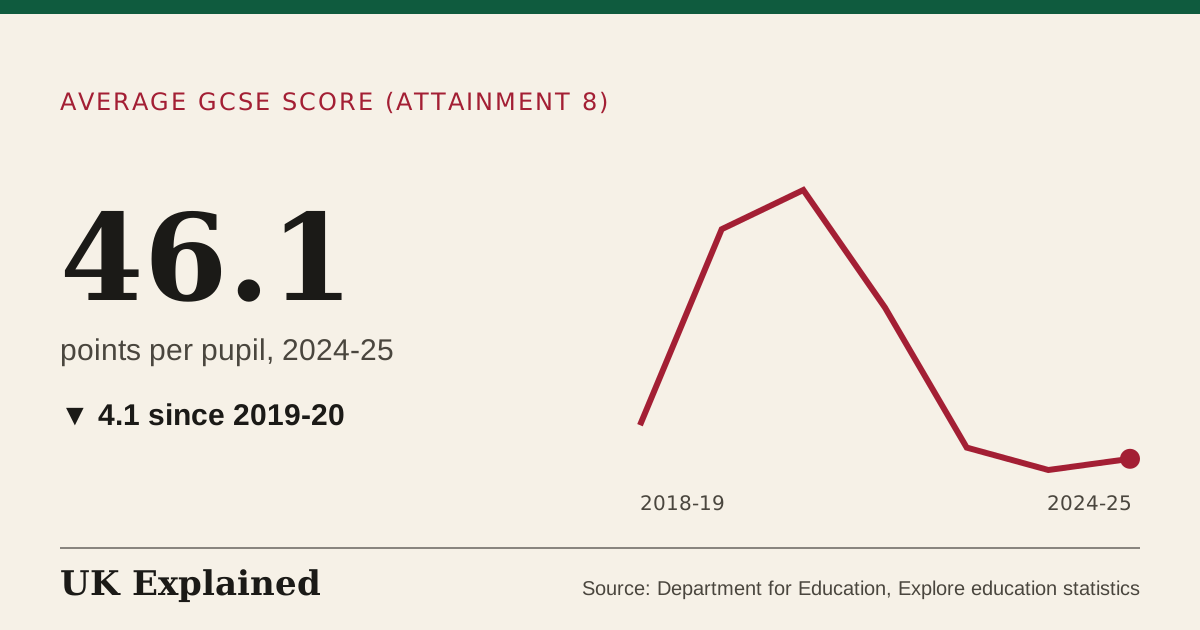
- points per pupil · 2018–19 to 2024–25 · Source: Department for Education, Explore education statistics · Updated 7 November 2026
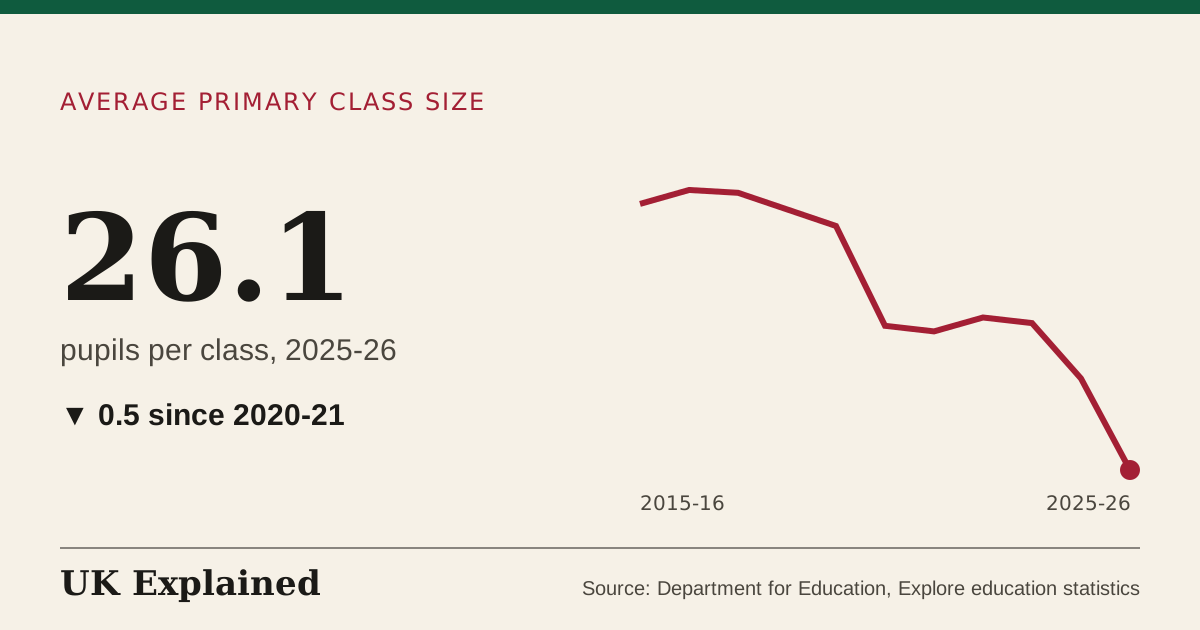
- pupils per class · 2015–16 to 2025–26 · Source: Department for Education, Explore education statistics · Updated 7 November 2026
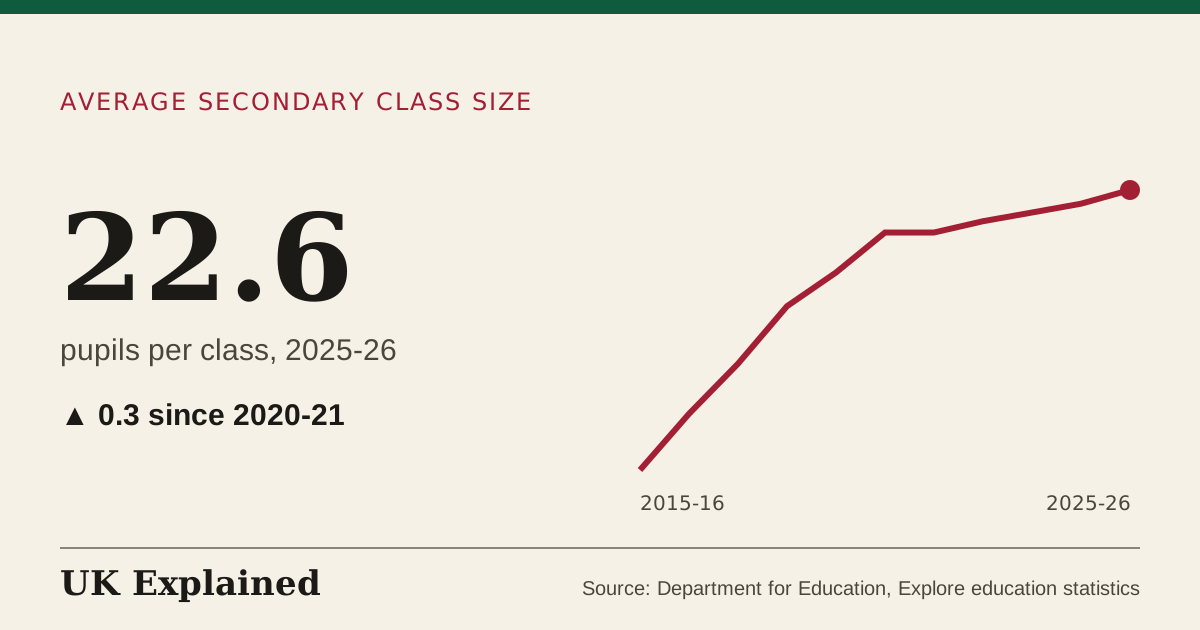
- pupils per class · 2015–16 to 2025–26 · Source: Department for Education, Explore education statistics · Updated 7 November 2026
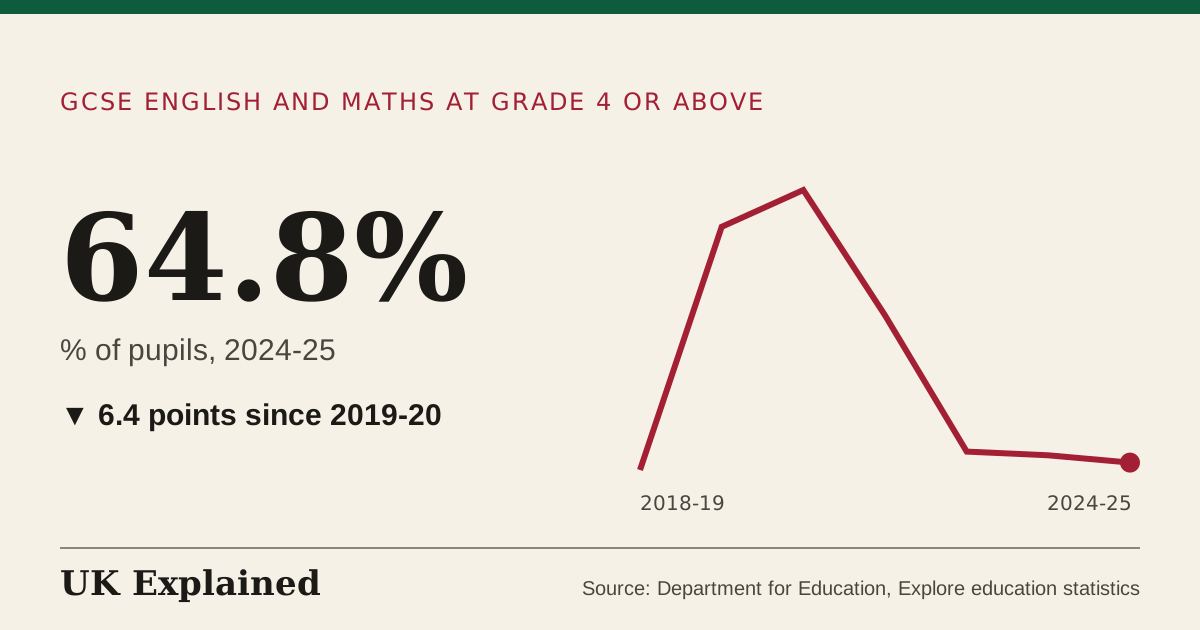
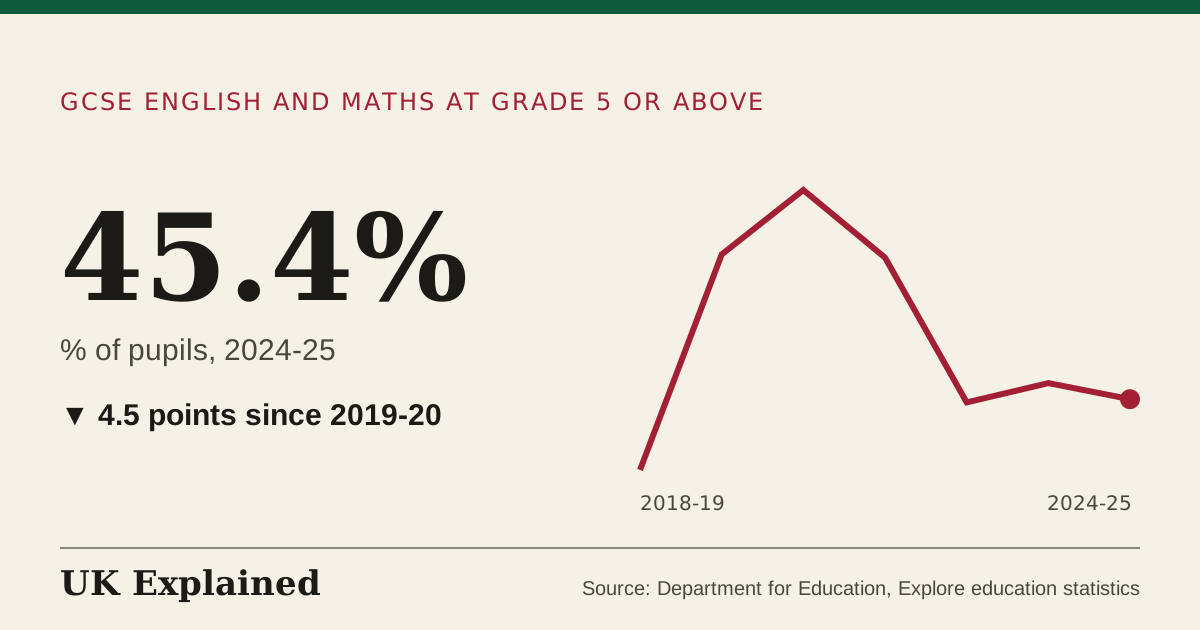
- % of pupils · 2018–19 to 2024–25 · Source: Department for Education, Explore education statistics · Updated 7 November 2026
- % of pupils · 2018–19 to 2024–25 · Source: Department for Education, Explore education statistics · Updated 7 November 2026
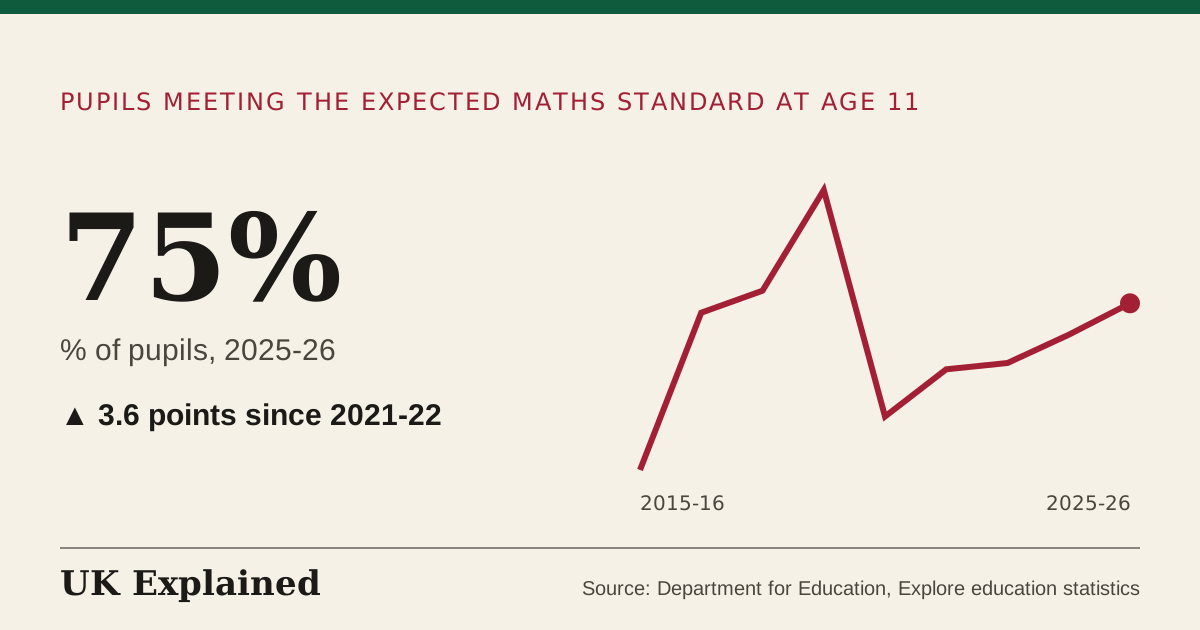
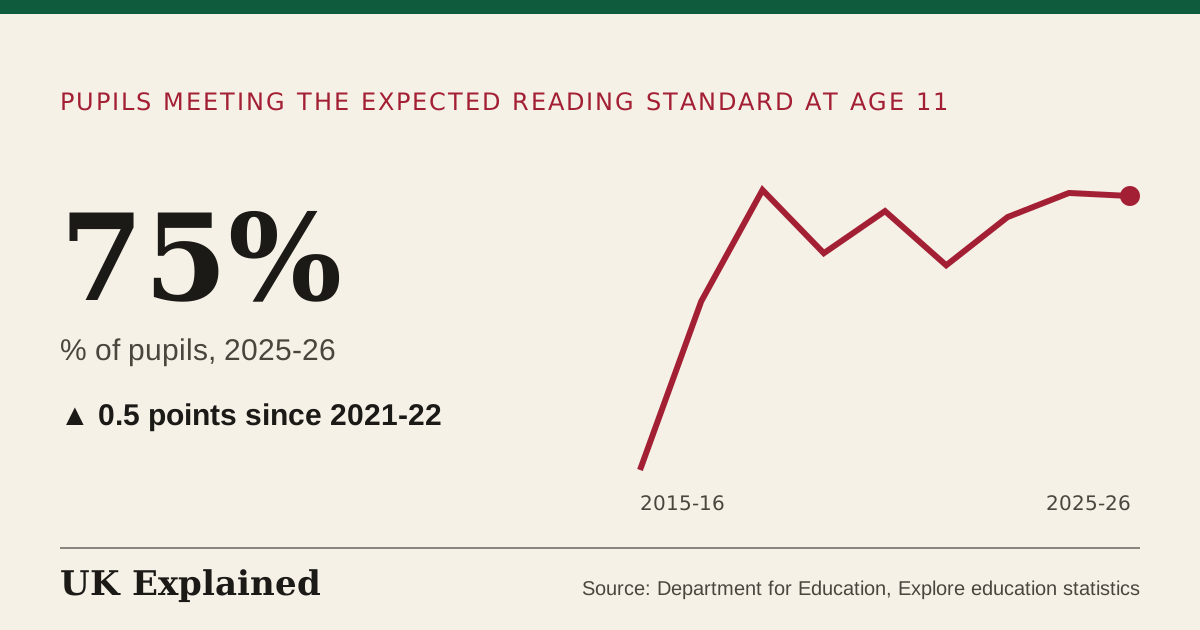
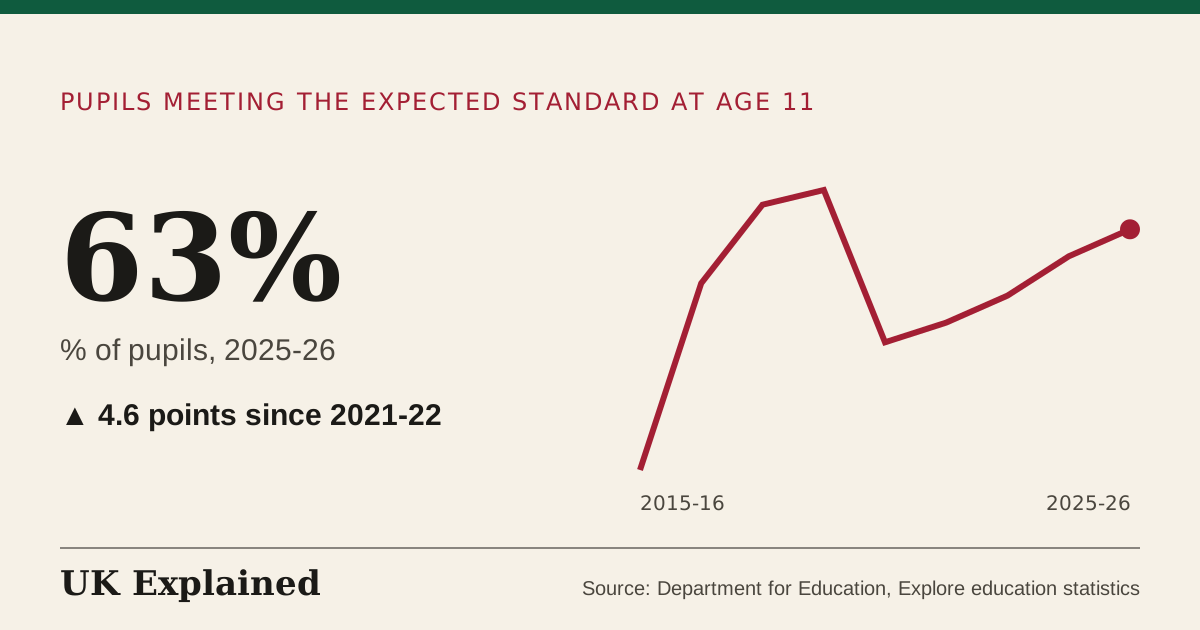
- % of pupils · 2015–16 to 2025–26 · Source: Department for Education, Explore education statistics · Updated 7 November 2026
- % of pupils · 2015–16 to 2025–26 · Source: Department for Education, Explore education statistics · Updated 7 November 2026
- % of pupils · 2015–16 to 2025–26 · Source: Department for Education, Explore education statistics · Updated 7 November 2026
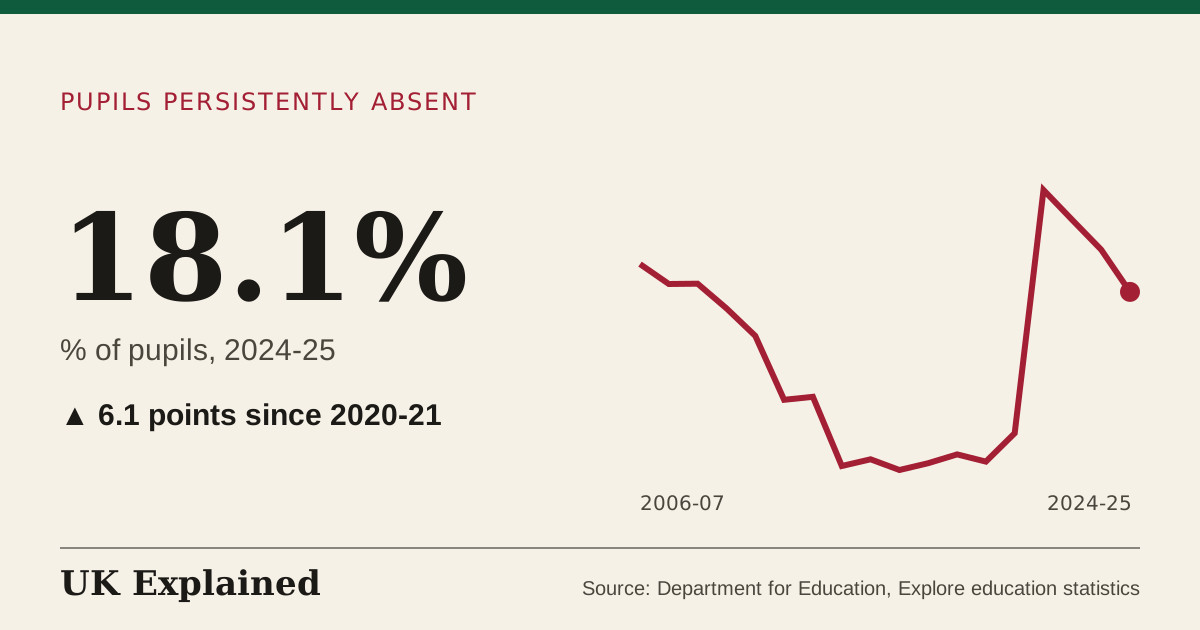
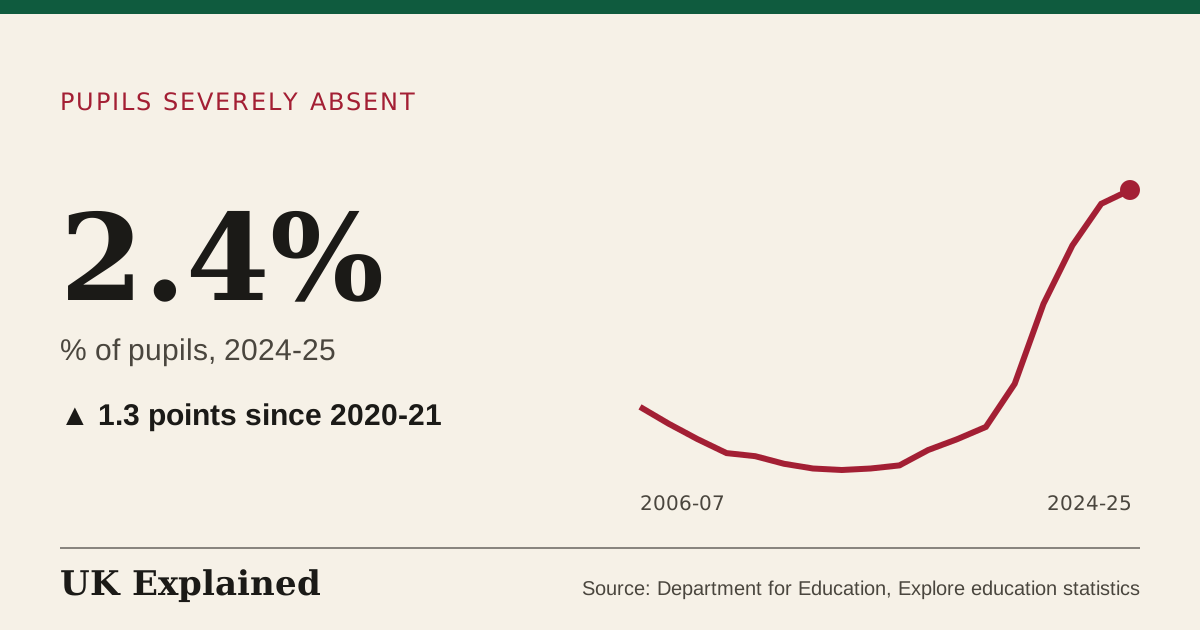
- % of pupils · 2006–07 to 2024–25 · Source: Department for Education, Explore education statistics · Updated 7 November 2026
- % of pupils · 2006–07 to 2024–25 · Source: Department for Education, Explore education statistics · Updated 7 November 2026
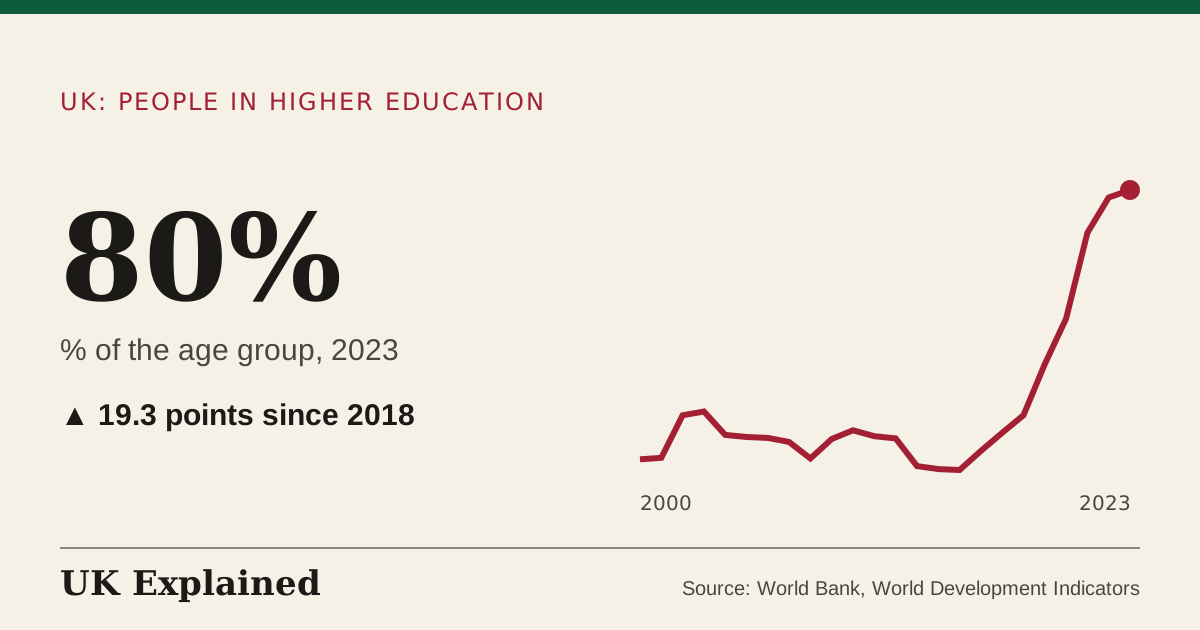
- % of the age group · 2000 to 2023 · Source: World Bank, World Development Indicators · Updated 7 November 2026
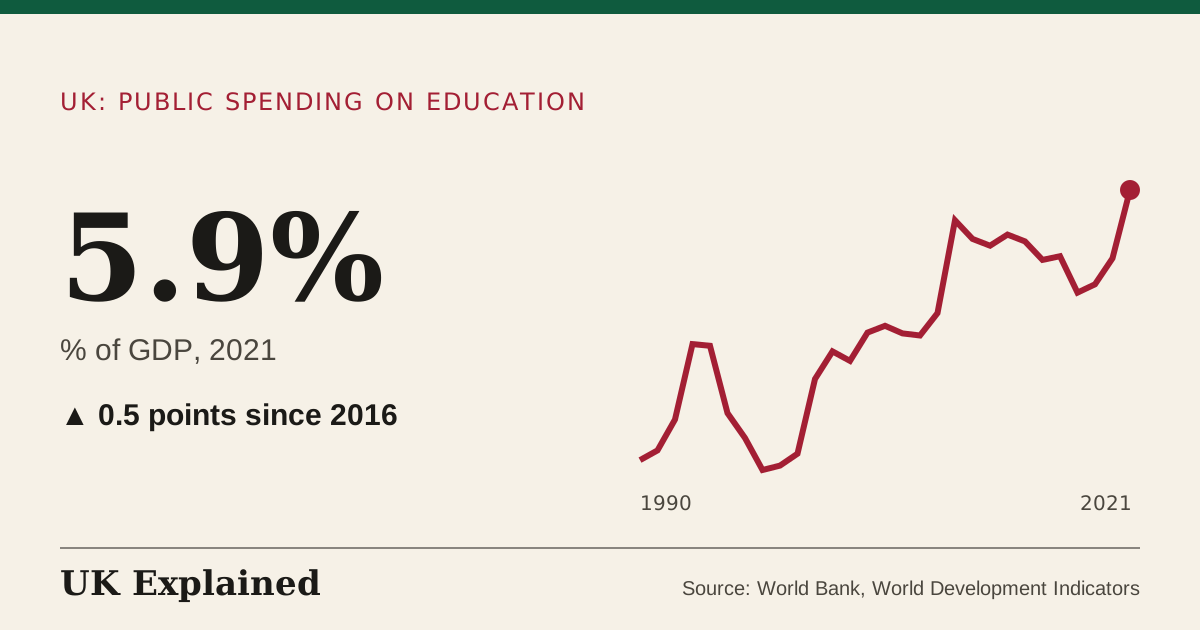
- % of GDP · 1990 to 2021 · Source: World Bank, World Development Indicators · Updated 7 November 2026
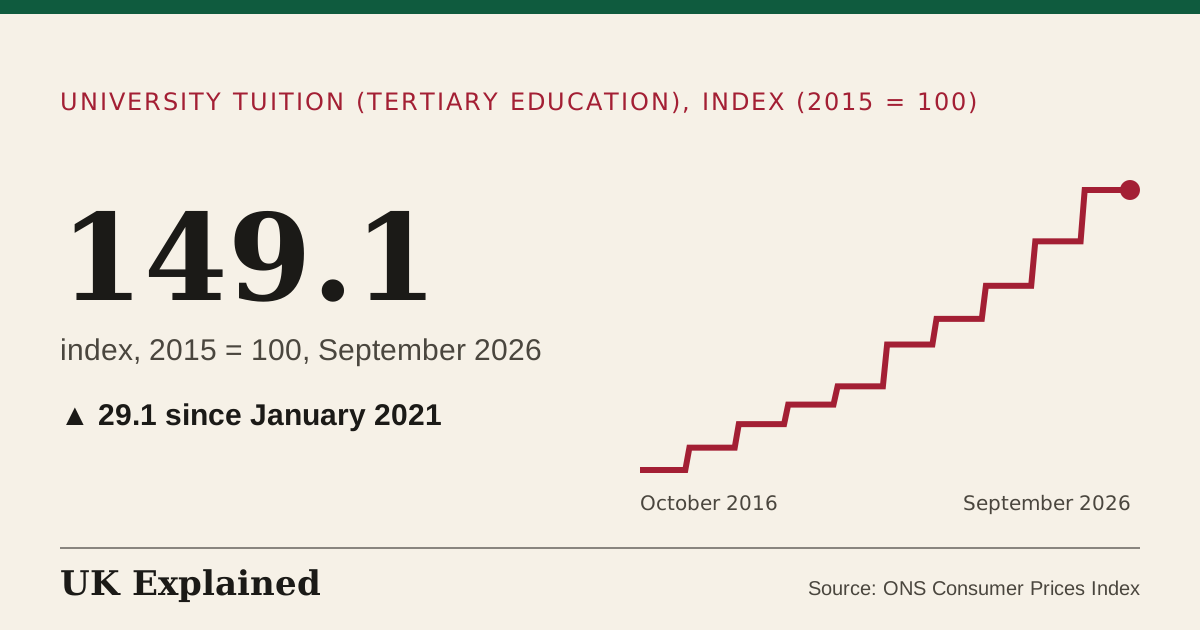
- index, 2015 = 100 · January 2015 to September 2026 · Source: ONS Consumer Prices Index · Updated 7 November 2026
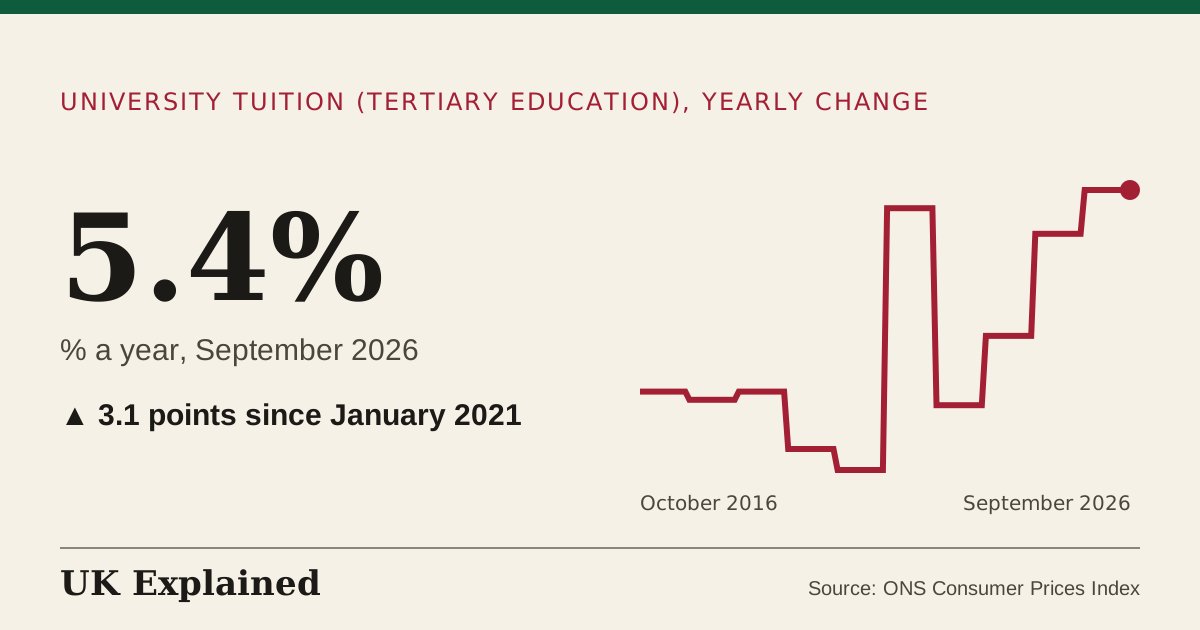
- % a year · January 2016 to September 2026 · Source: ONS Consumer Prices Index · Updated 7 November 2026
Crime and justice
(27)
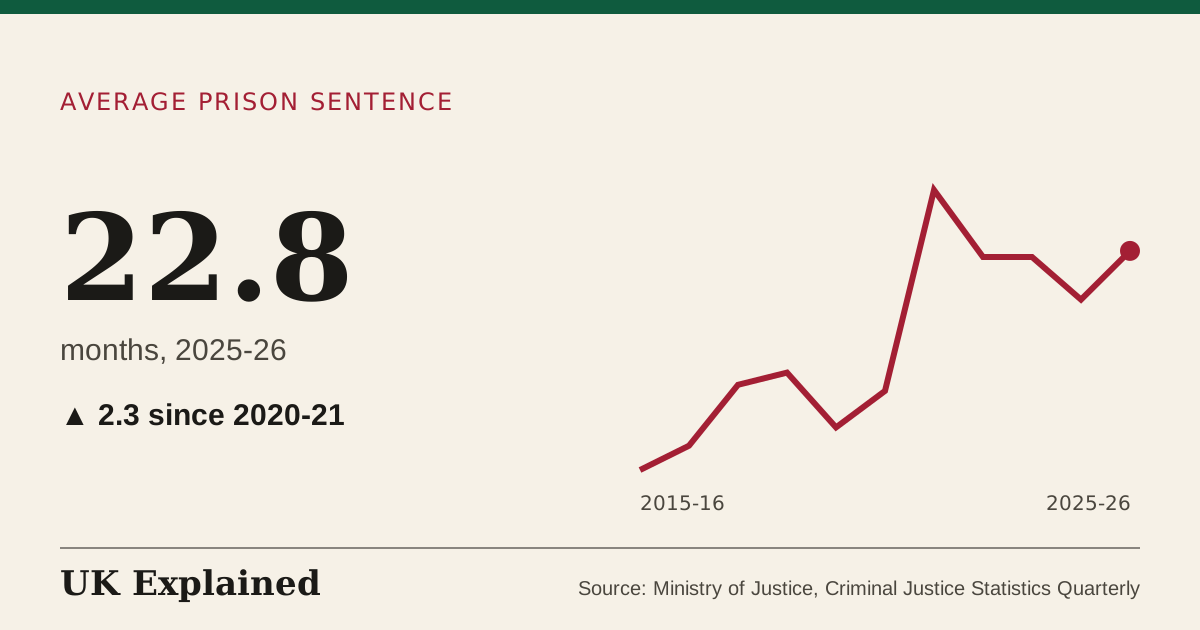
- months · 2015–16 to 2025–26 · Source: Ministry of Justice, Criminal Justice Statistics Quarterly · Updated 7 November 2026
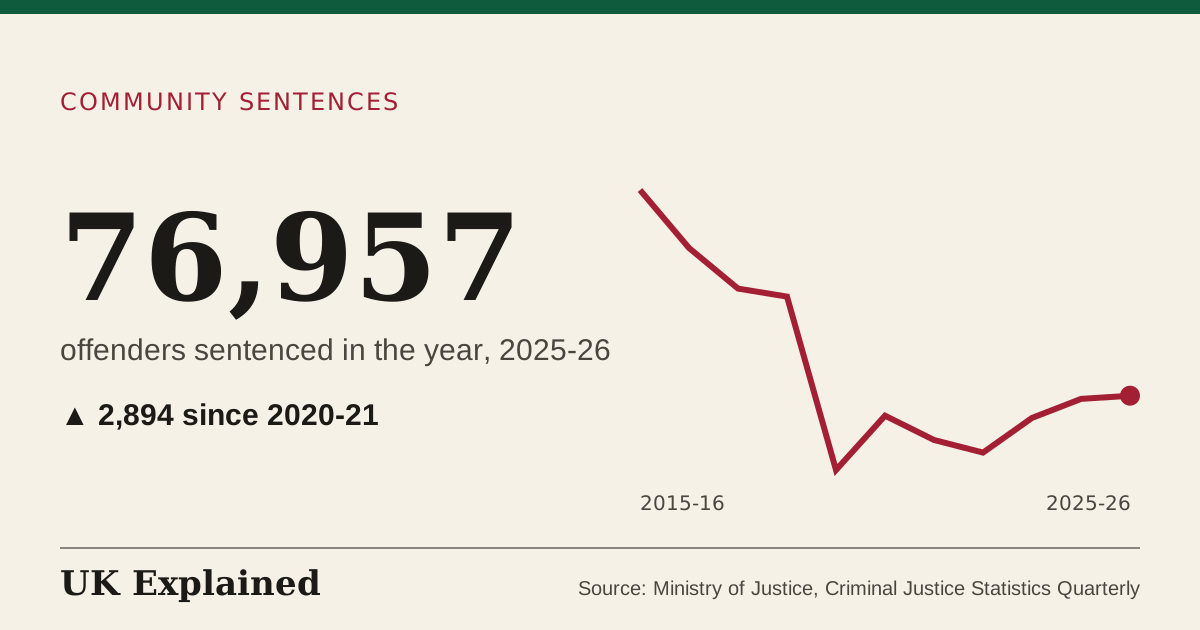
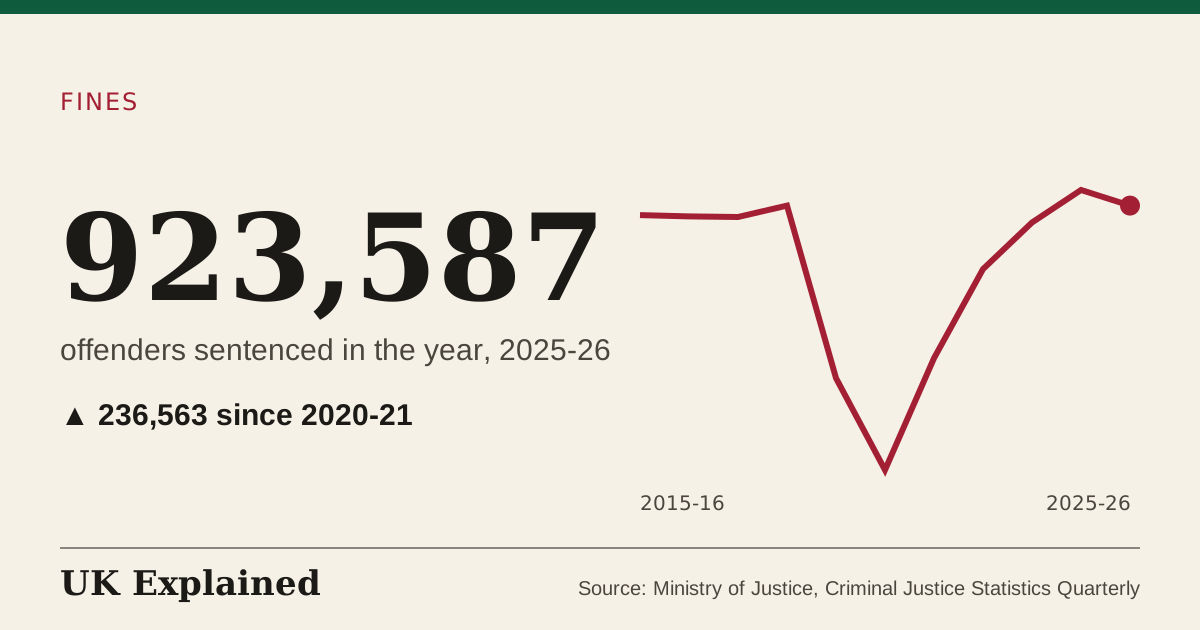
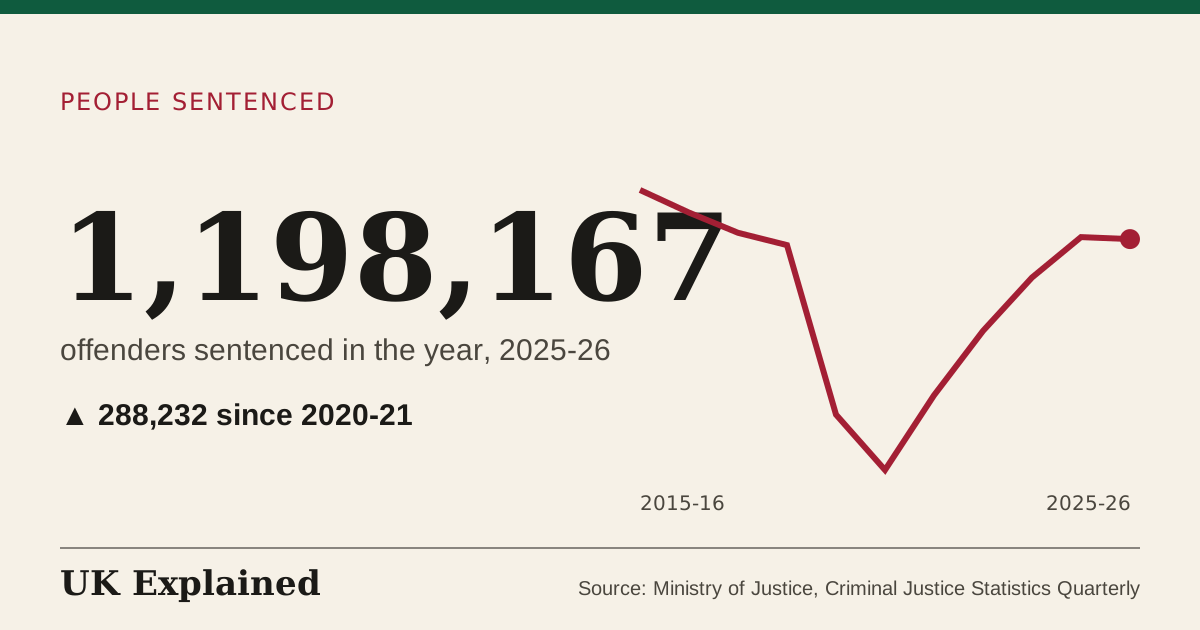
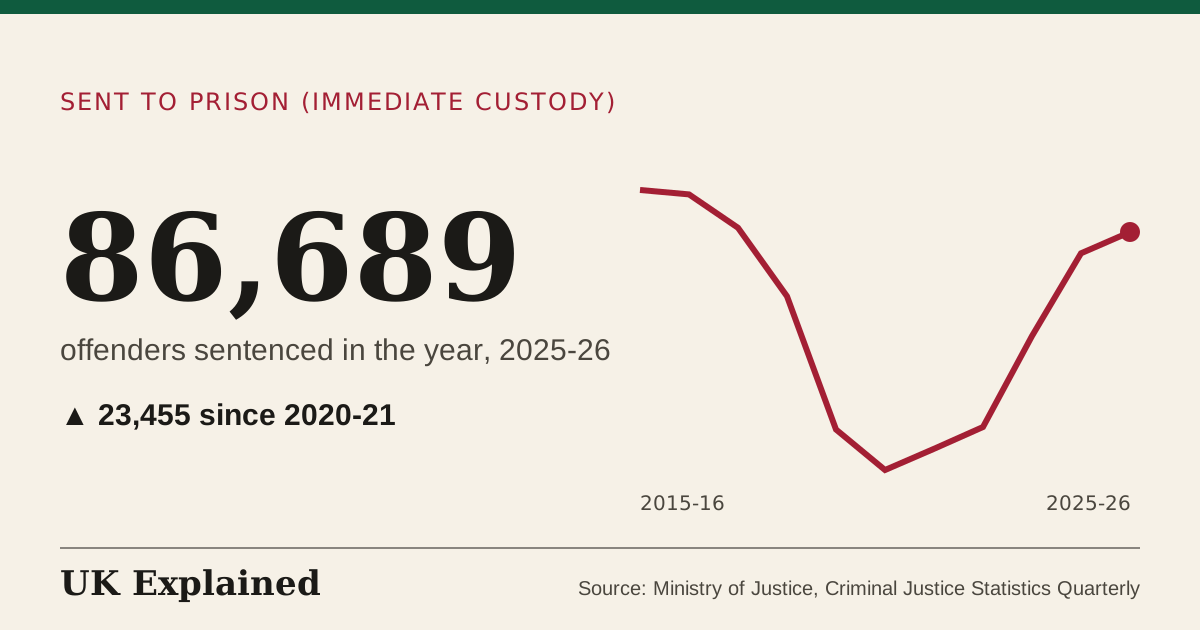
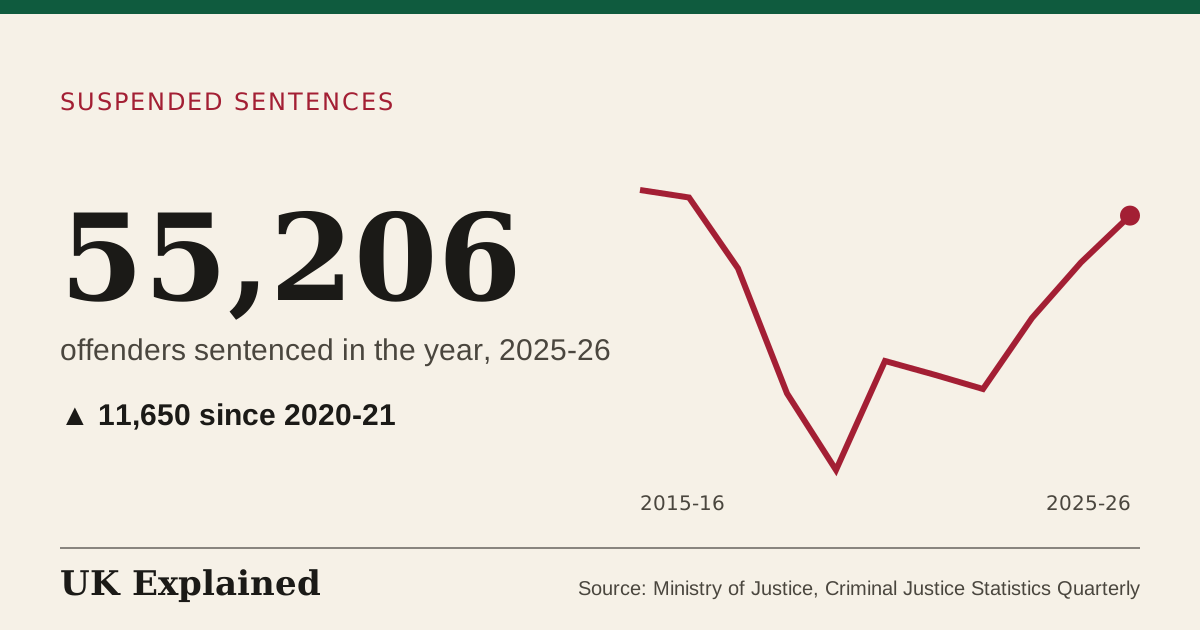
- offenders sentenced in the year · 2015–16 to 2025–26 · Source: Ministry of Justice, Criminal Justice Statistics Quarterly · Updated 7 November 2026
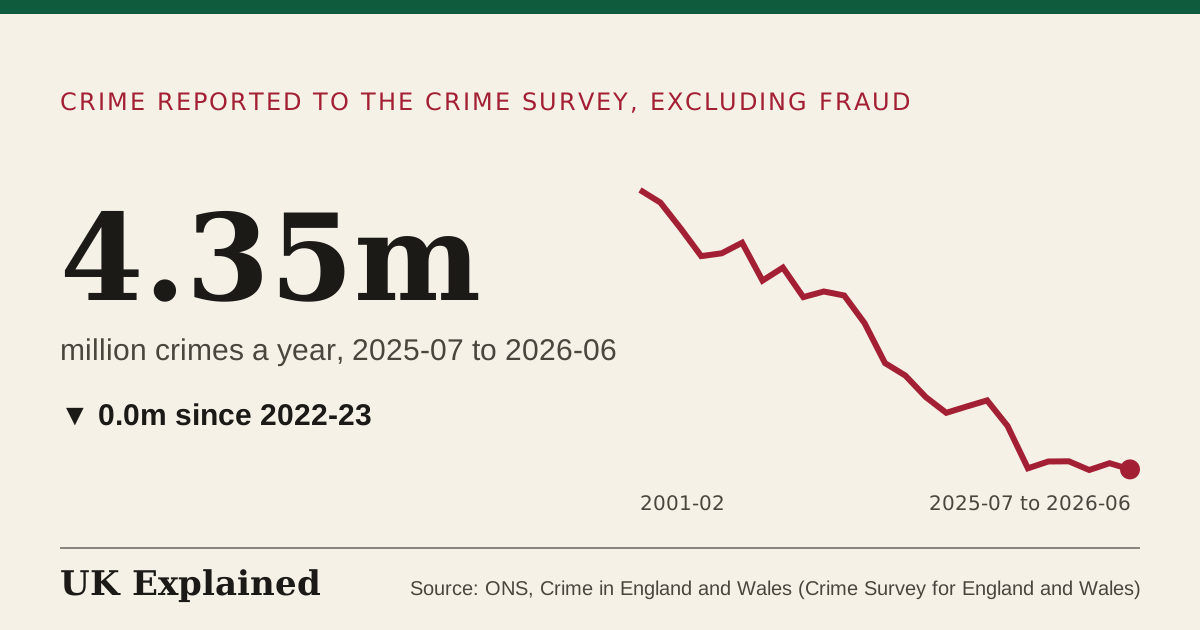
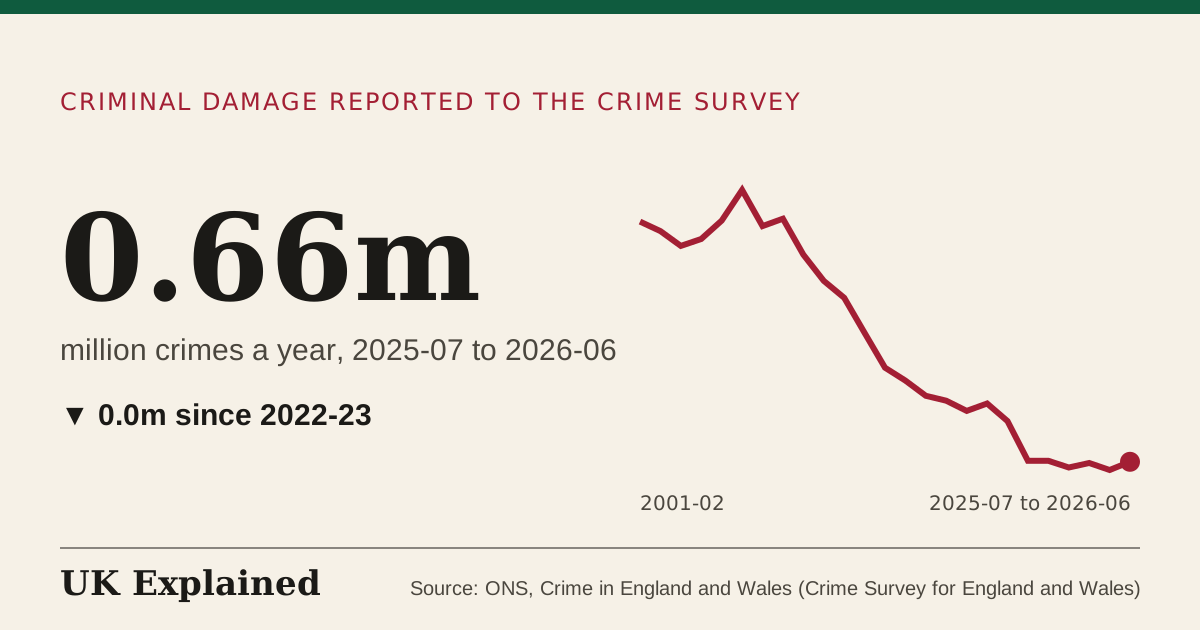
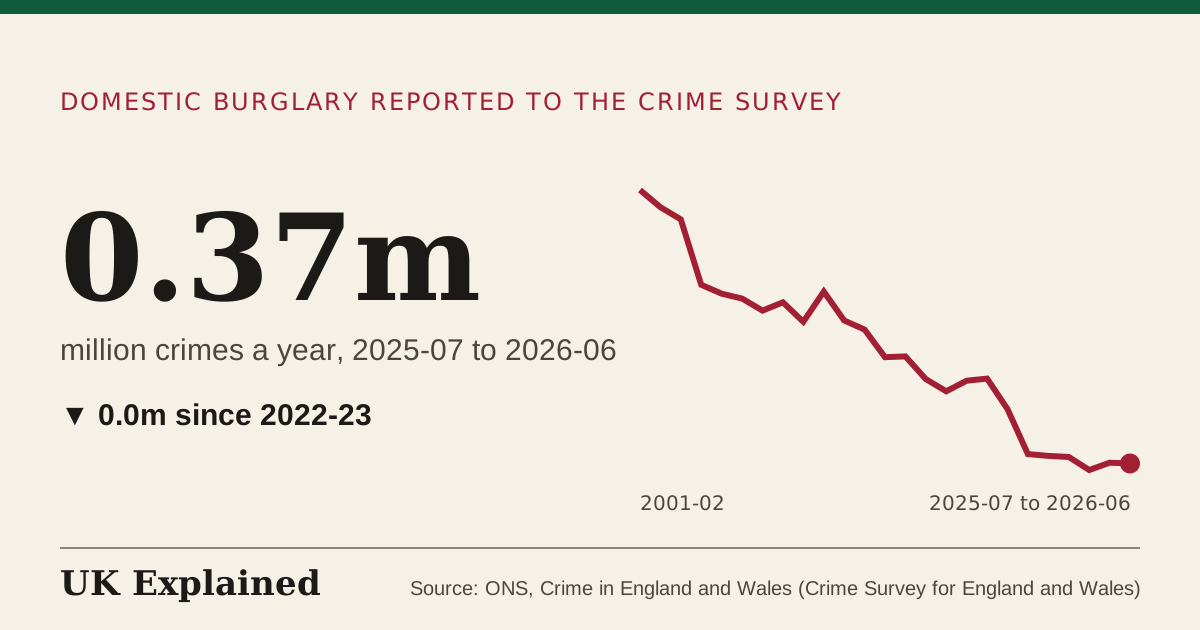
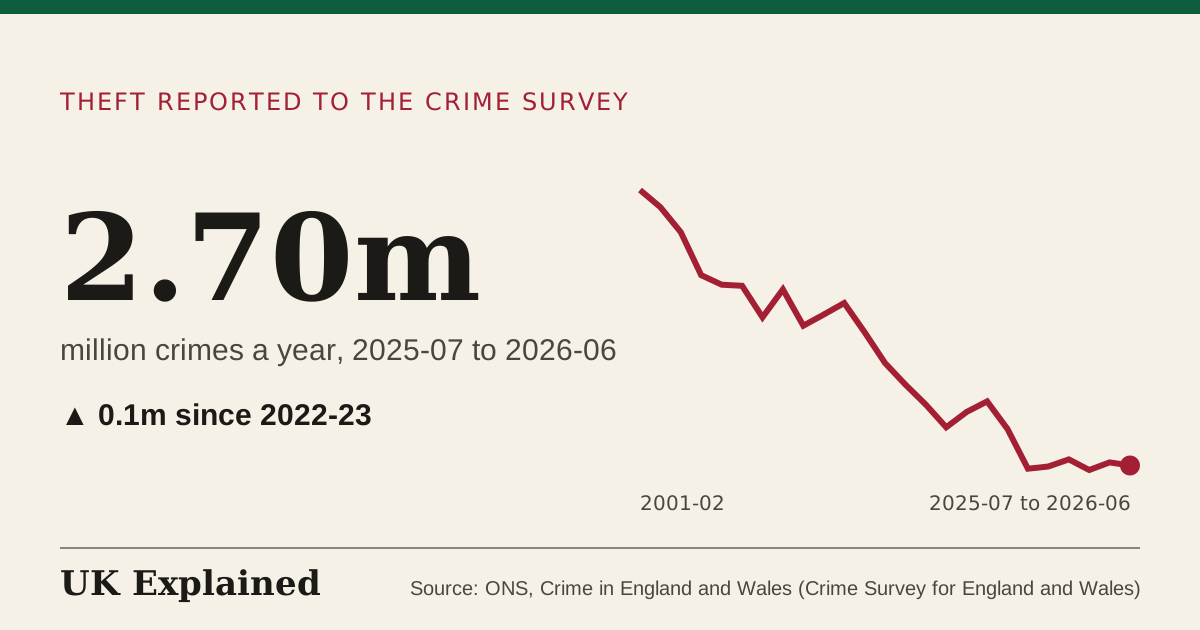
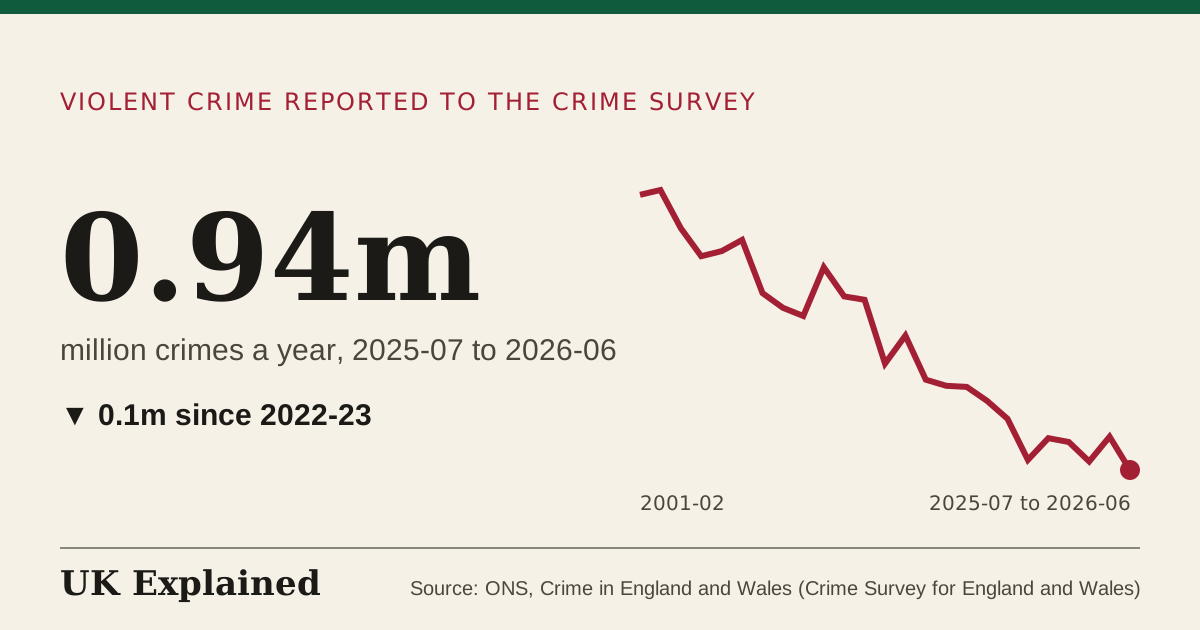
- million crimes a year · 2001–02 to 2025-07 to 2026-06 · Source: ONS, Crime in England and Wales (Crime Survey for England and Wales) · Updated 7 November 2026
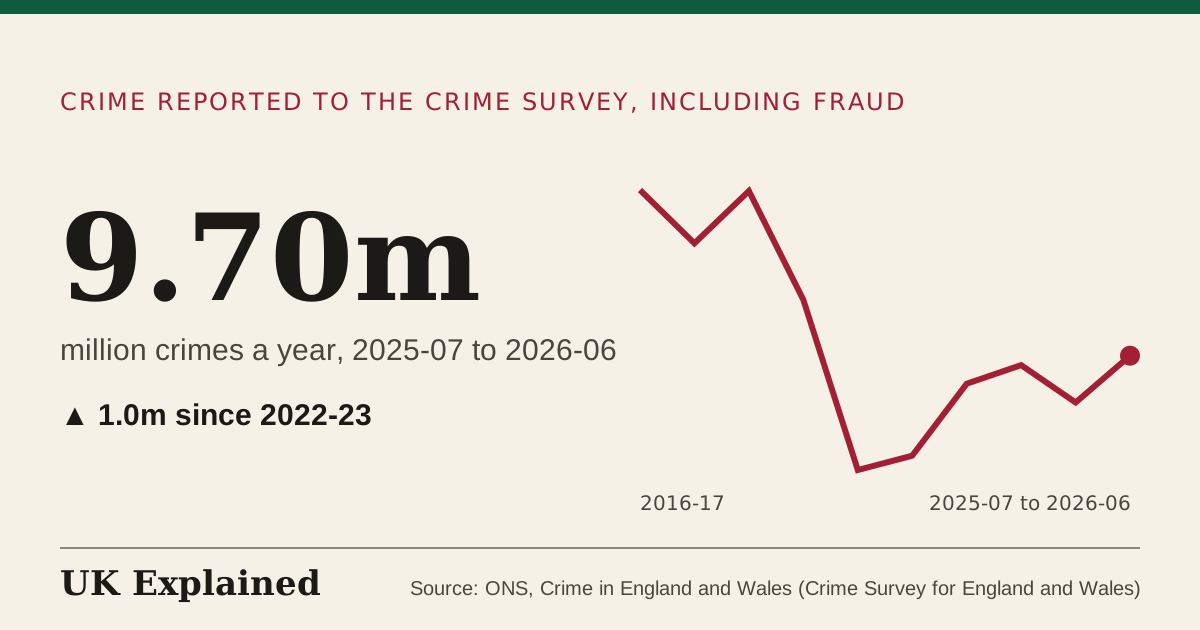
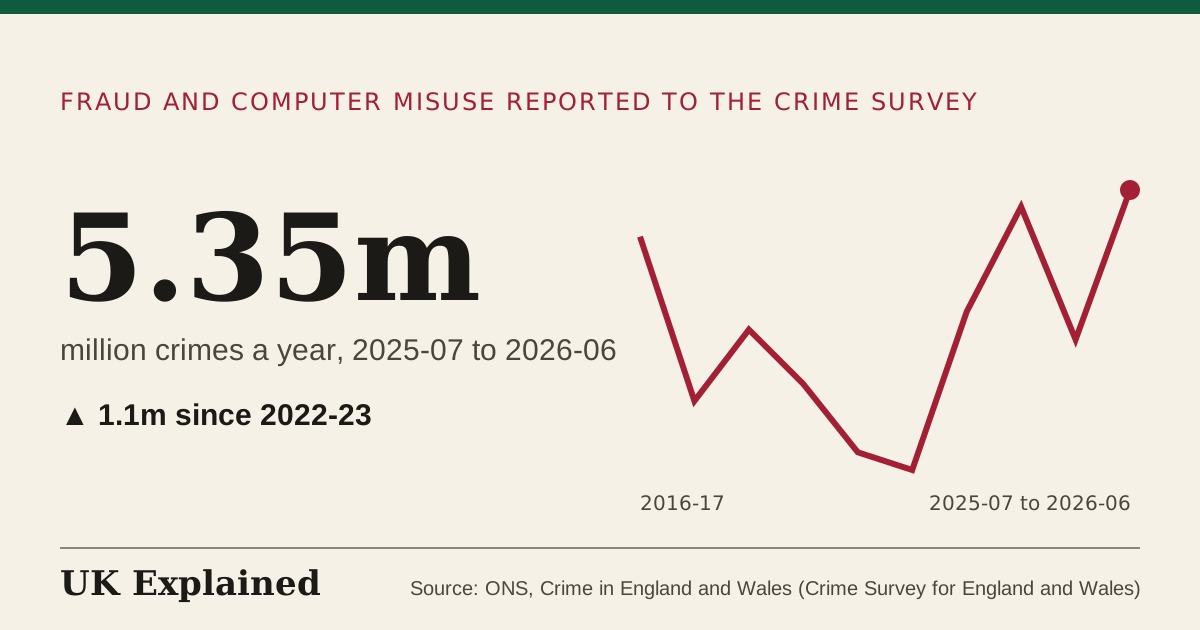
- million crimes a year · 2016–17 to 2025-07 to 2026-06 · Source: ONS, Crime in England and Wales (Crime Survey for England and Wales) · Updated 7 November 2026
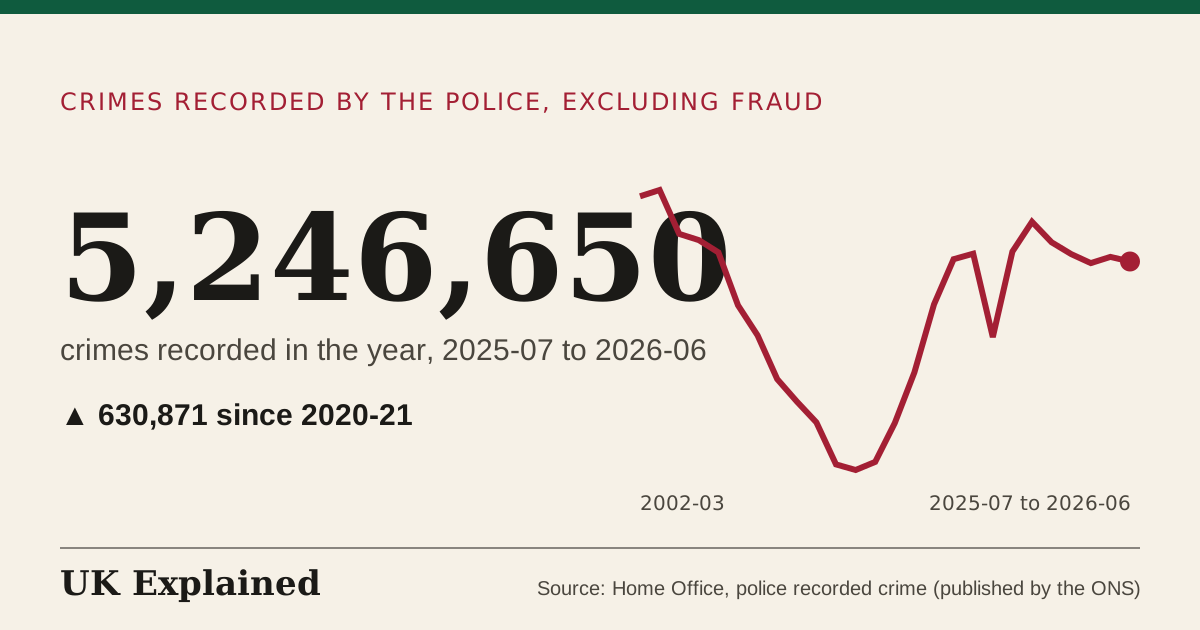
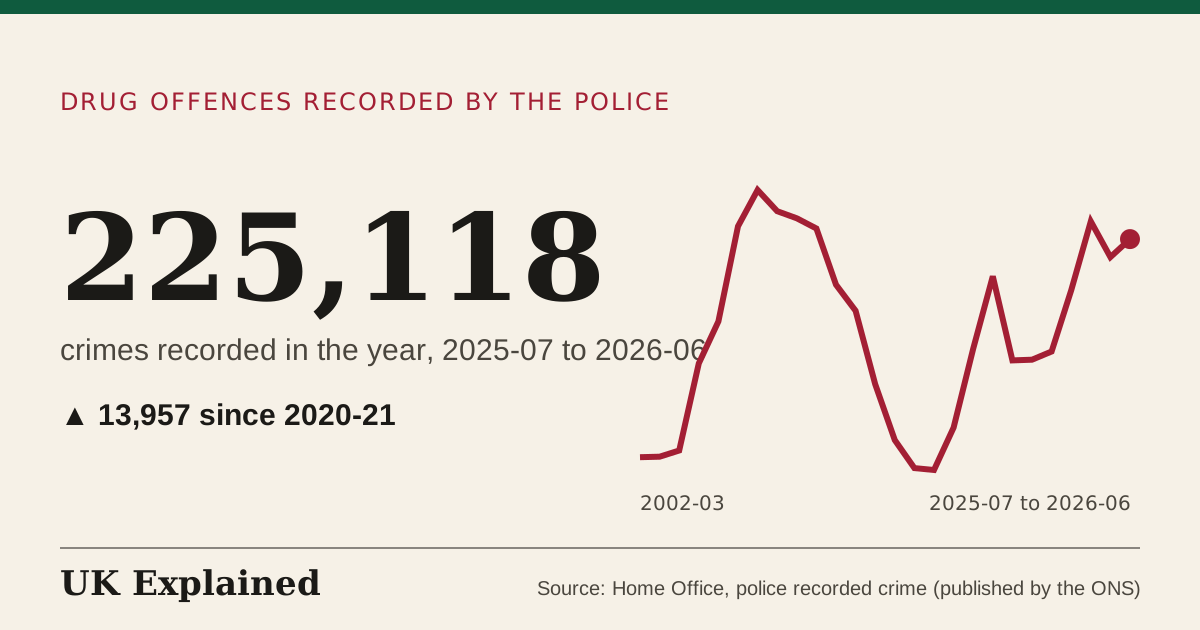
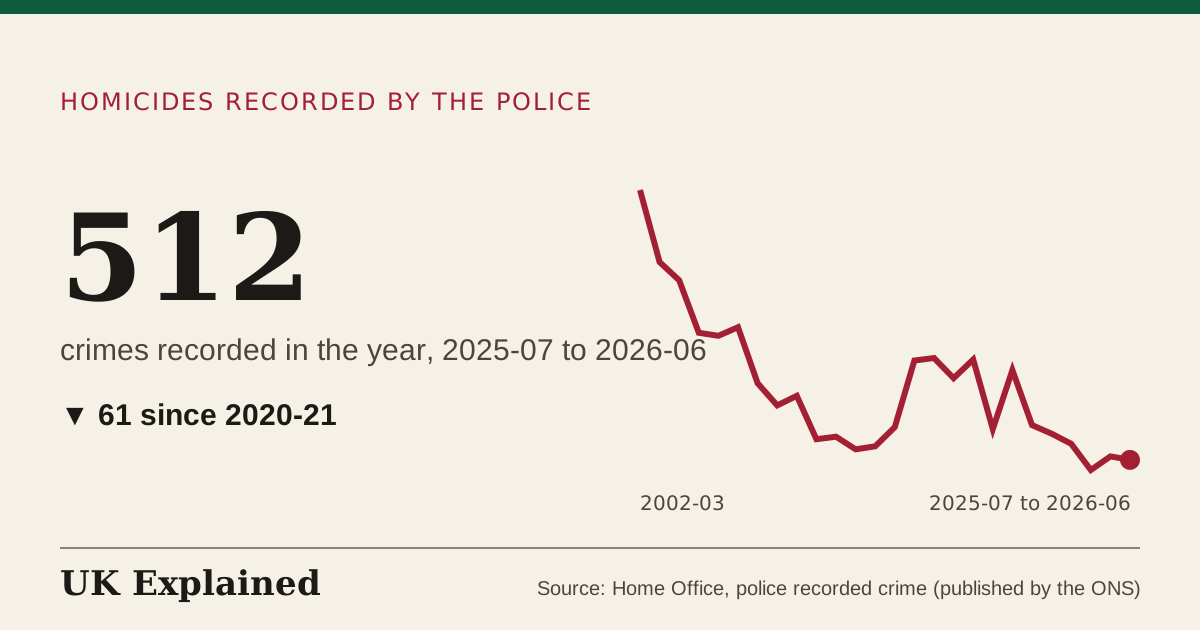
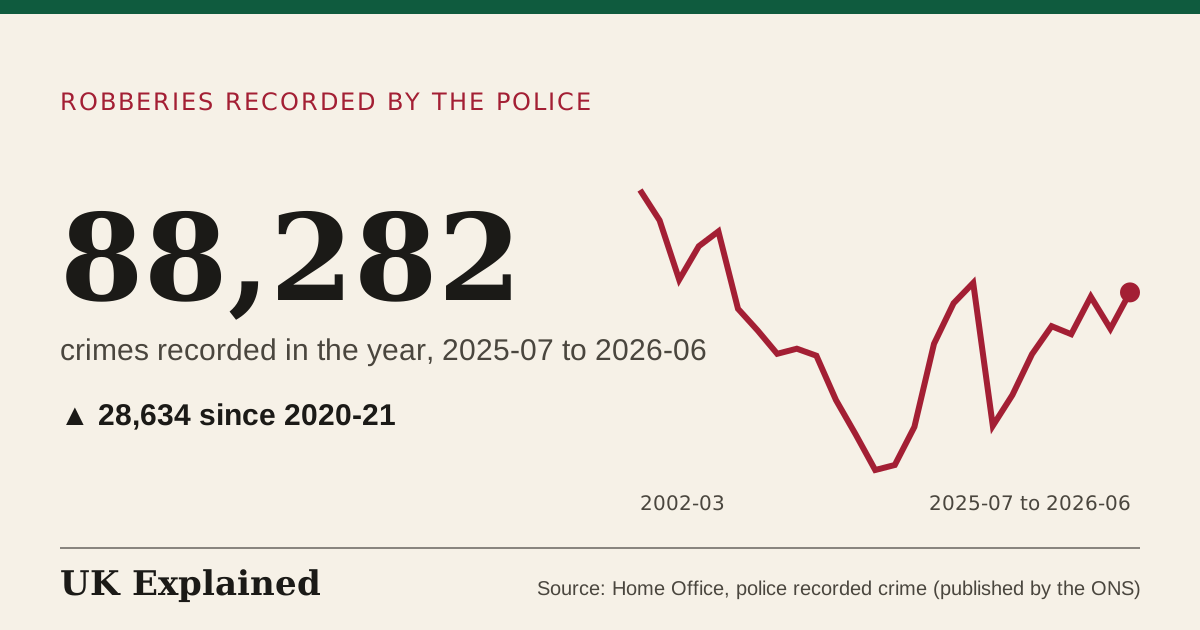
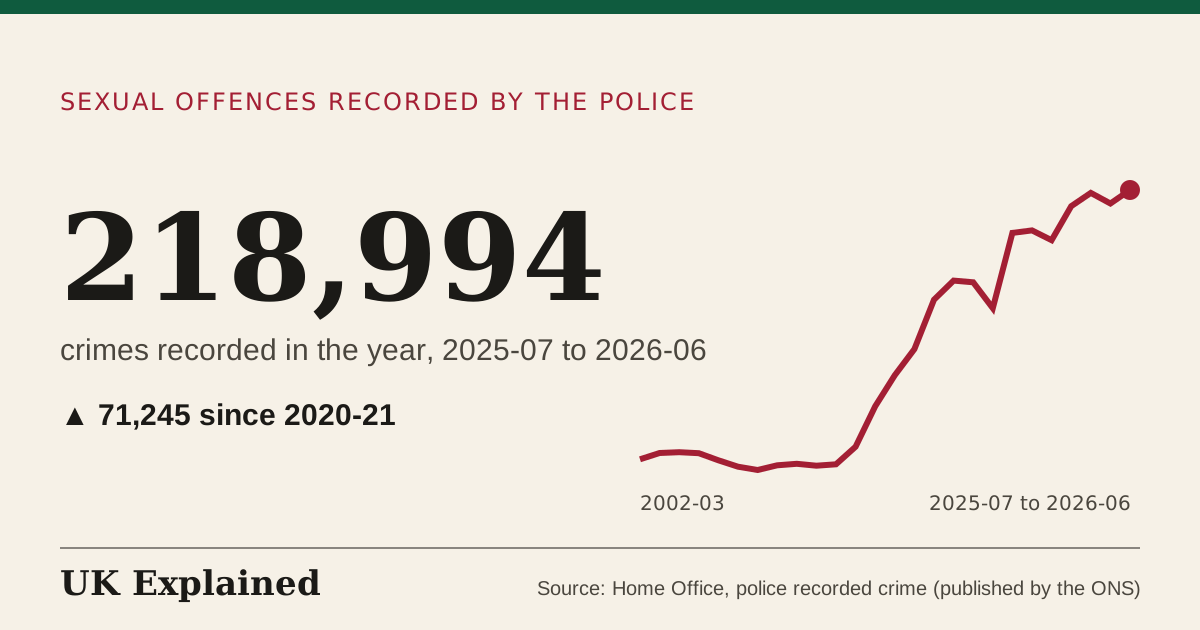
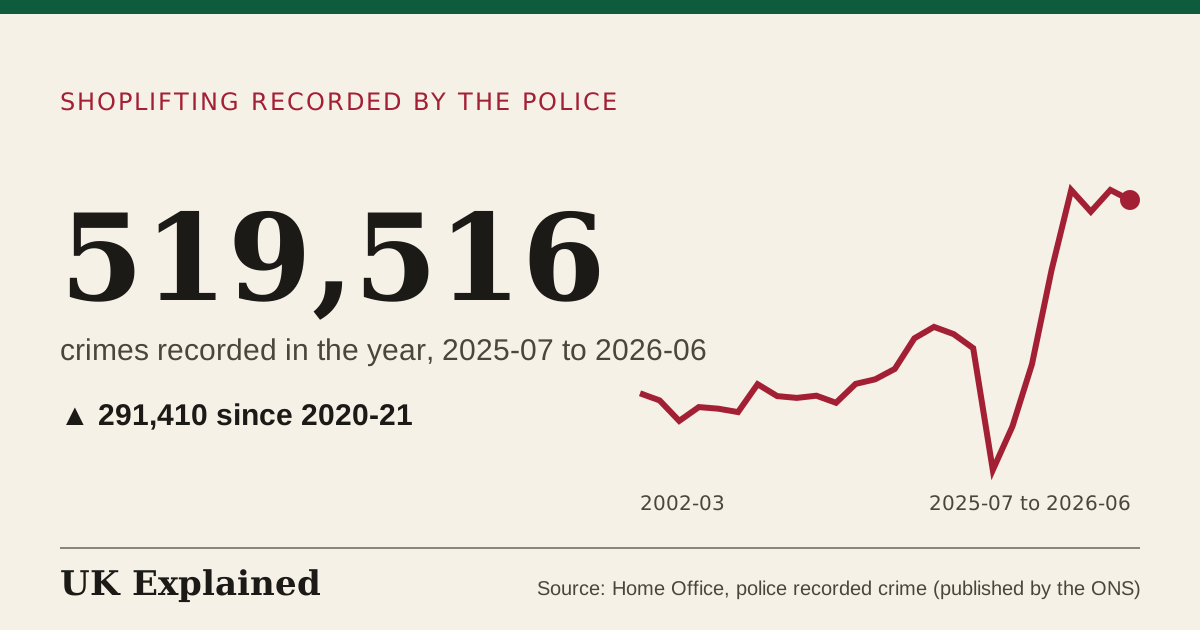
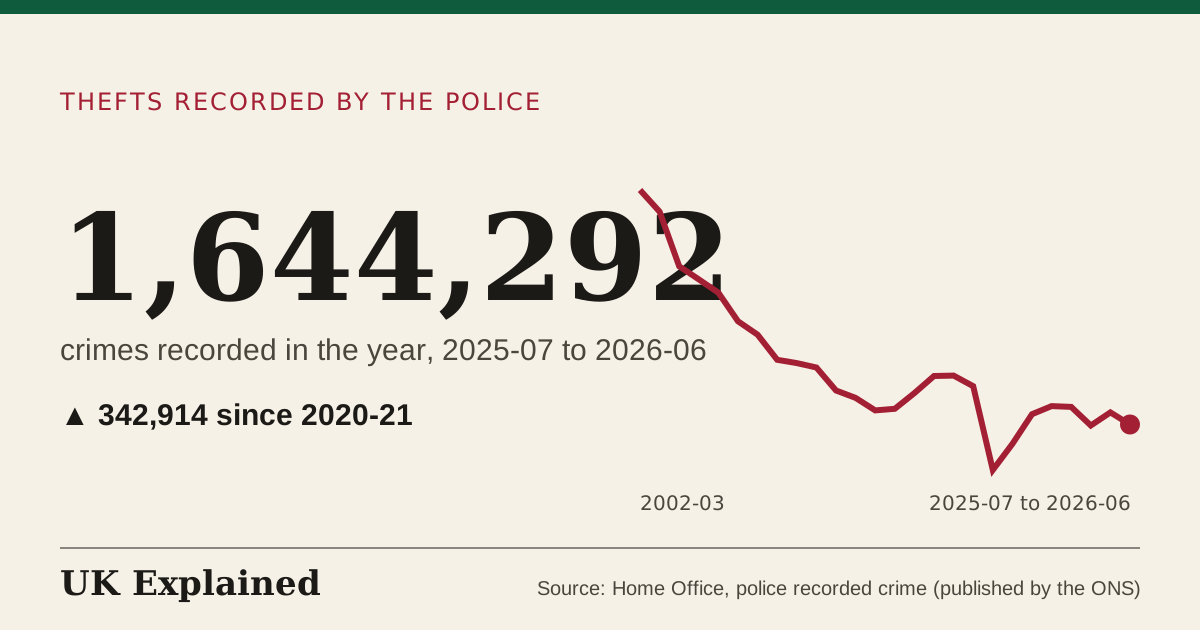
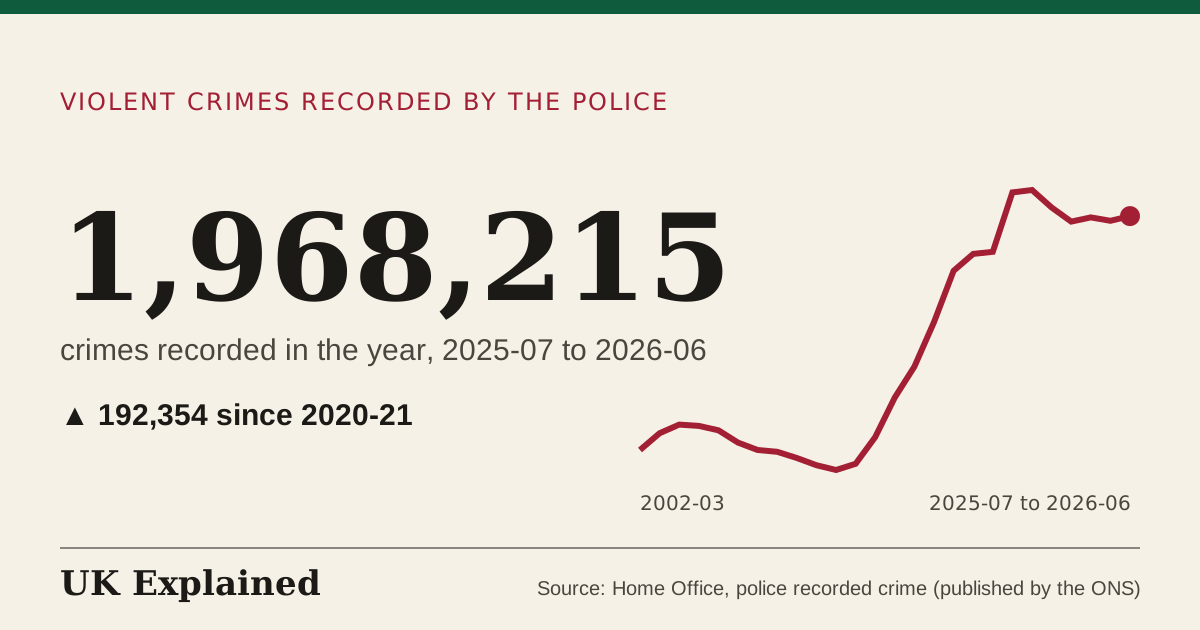
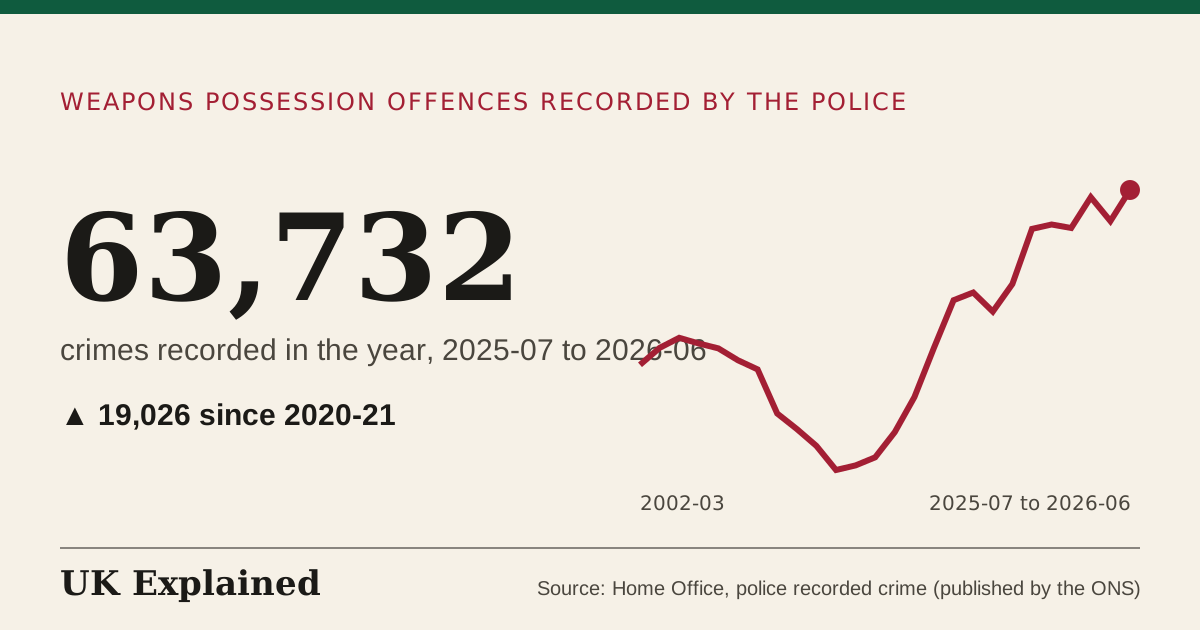
- crimes recorded in the year · 2002–03 to 2025-07 to 2026-06 · Source: Home Office, police recorded crime (published by the ONS) · Updated 7 November 2026
- million crimes a year · 2001–02 to 2025-07 to 2026-06 · Source: ONS, Crime in England and Wales (Crime Survey for England and Wales) · Updated 7 November 2026
- million crimes a year · 2001–02 to 2025-07 to 2026-06 · Source: ONS, Crime in England and Wales (Crime Survey for England and Wales) · Updated 7 November 2026
- crimes recorded in the year · 2002–03 to 2025-07 to 2026-06 · Source: Home Office, police recorded crime (published by the ONS) · Updated 7 November 2026
- offenders sentenced in the year · 2015–16 to 2025–26 · Source: Ministry of Justice, Criminal Justice Statistics Quarterly · Updated 7 November 2026
- million crimes a year · 2016–17 to 2025-07 to 2026-06 · Source: ONS, Crime in England and Wales (Crime Survey for England and Wales) · Updated 7 November 2026
- crimes recorded in the year · 2002–03 to 2025-07 to 2026-06 · Source: Home Office, police recorded crime (published by the ONS) · Updated 7 November 2026
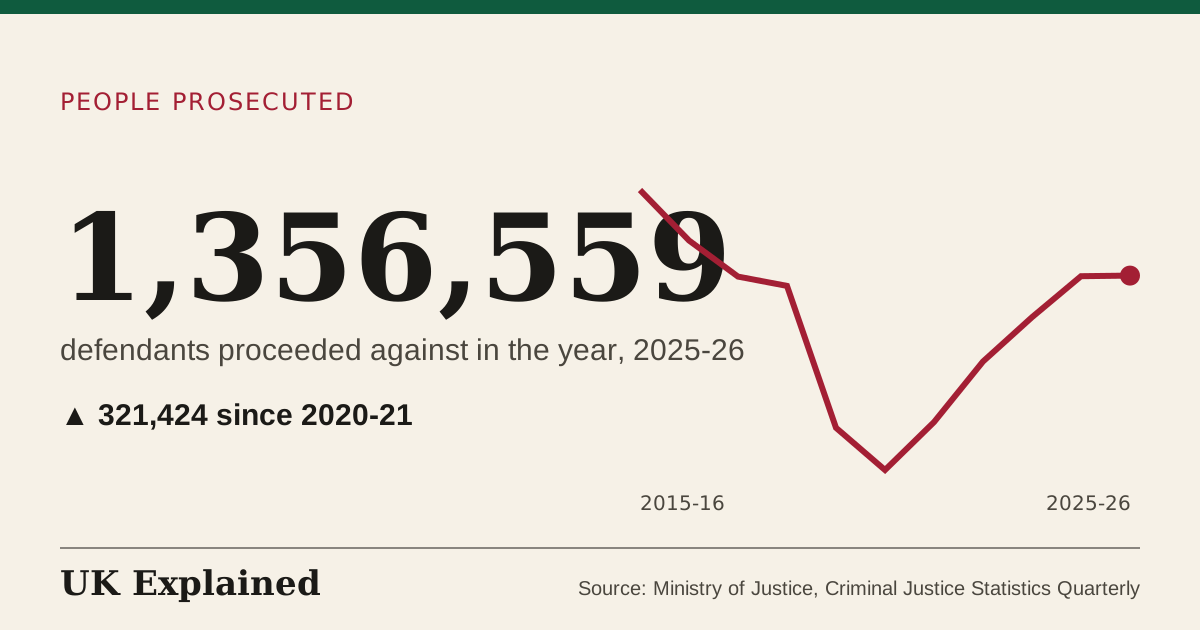
- defendants proceeded against in the year · 2015–16 to 2025–26 · Source: Ministry of Justice, Criminal Justice Statistics Quarterly · Updated 7 November 2026
- offenders sentenced in the year · 2015–16 to 2025–26 · Source: Ministry of Justice, Criminal Justice Statistics Quarterly · Updated 7 November 2026
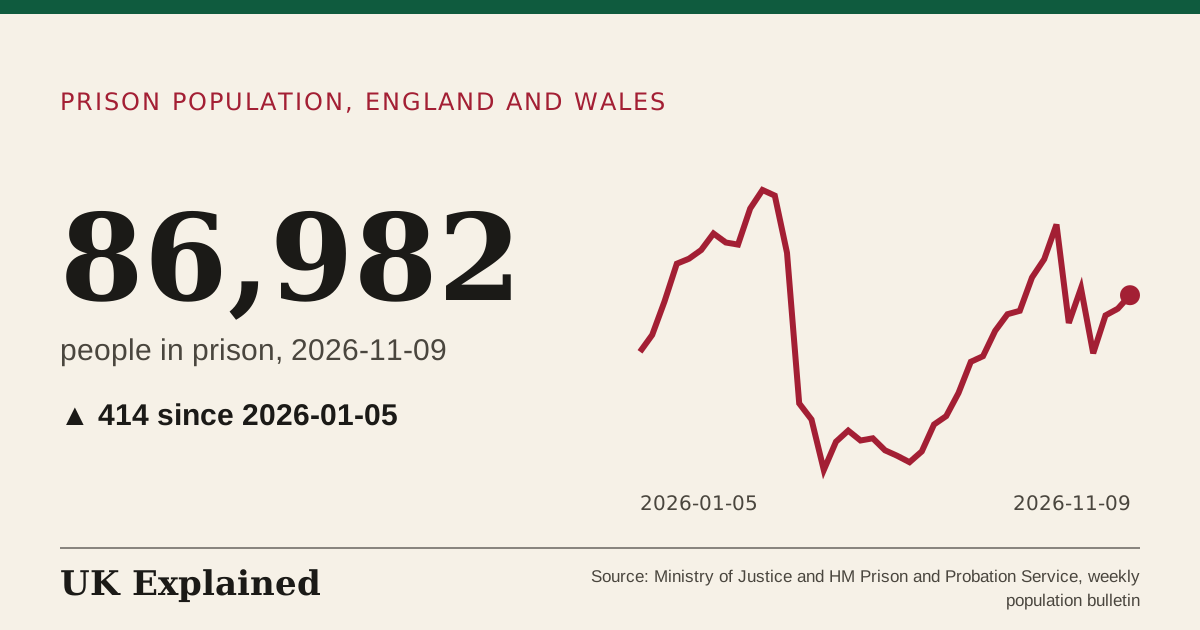
- people in prison · 2026-01-05 to 2026-11-09 · Source: Ministry of Justice and HM Prison and Probation Service, weekly population bulletin · Updated 9 November 2026
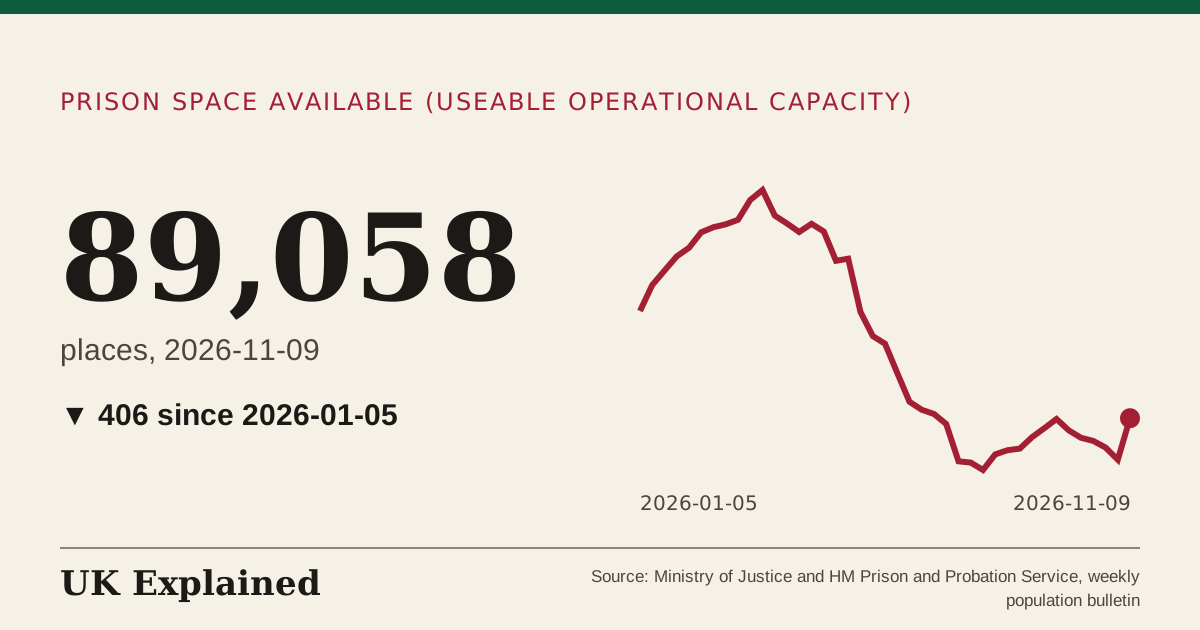
- places · 2026-01-05 to 2026-11-09 · Source: Ministry of Justice and HM Prison and Probation Service, weekly population bulletin · Updated 9 November 2026
- crimes recorded in the year · 2002–03 to 2025-07 to 2026-06 · Source: Home Office, police recorded crime (published by the ONS) · Updated 7 November 2026
- offenders sentenced in the year · 2015–16 to 2025–26 · Source: Ministry of Justice, Criminal Justice Statistics Quarterly · Updated 7 November 2026
- crimes recorded in the year · 2002–03 to 2025-07 to 2026-06 · Source: Home Office, police recorded crime (published by the ONS) · Updated 7 November 2026
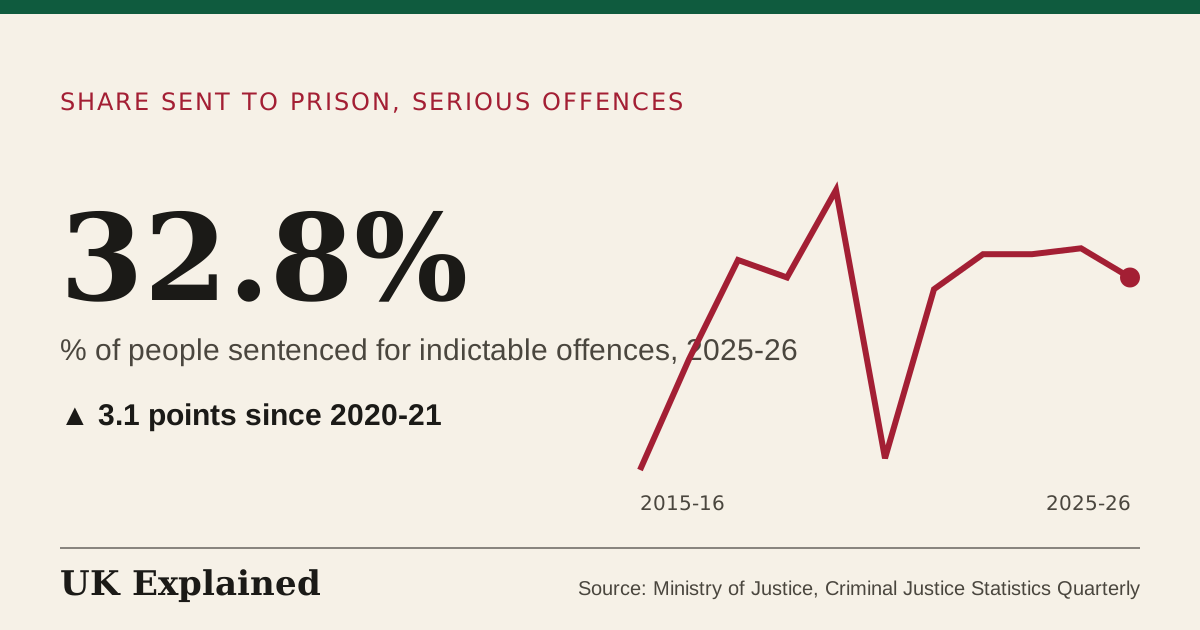
- % of people sentenced for indictable offences · 2015–16 to 2025–26 · Source: Ministry of Justice, Criminal Justice Statistics Quarterly · Updated 7 November 2026
- crimes recorded in the year · 2002–03 to 2025-07 to 2026-06 · Source: Home Office, police recorded crime (published by the ONS) · Updated 7 November 2026
- offenders sentenced in the year · 2015–16 to 2025–26 · Source: Ministry of Justice, Criminal Justice Statistics Quarterly · Updated 7 November 2026
- million crimes a year · 2001–02 to 2025-07 to 2026-06 · Source: ONS, Crime in England and Wales (Crime Survey for England and Wales) · Updated 7 November 2026
- crimes recorded in the year · 2002–03 to 2025-07 to 2026-06 · Source: Home Office, police recorded crime (published by the ONS) · Updated 7 November 2026
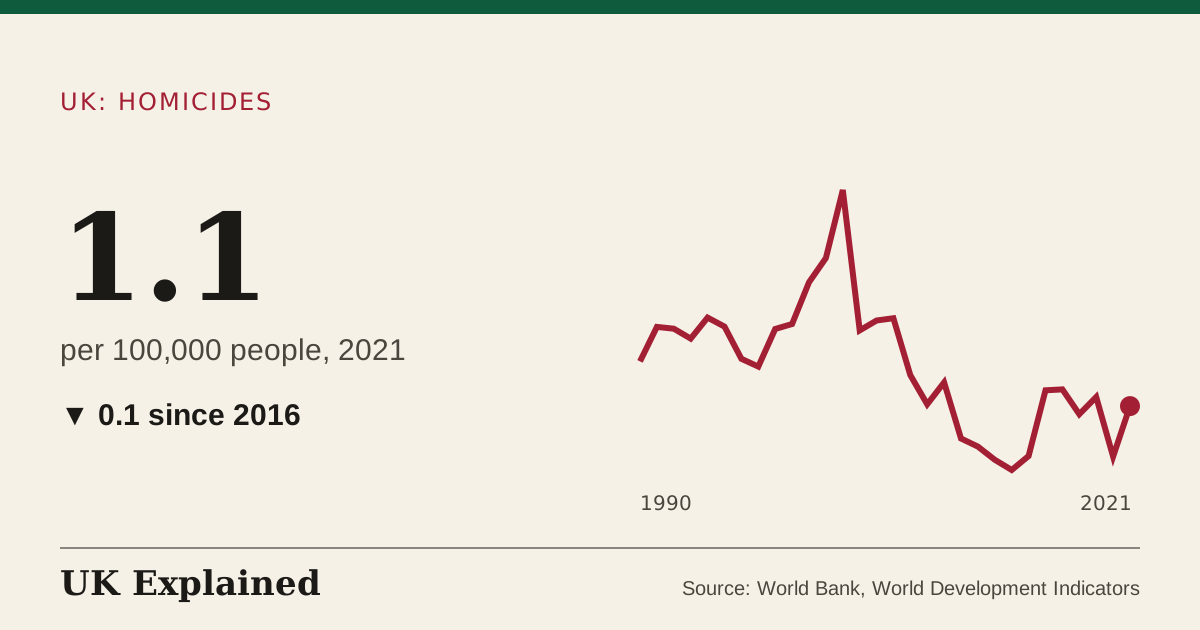
- per 100,000 people · 1990 to 2021 · Source: World Bank, World Development Indicators · Updated 7 November 2026
- million crimes a year · 2001–02 to 2025-07 to 2026-06 · Source: ONS, Crime in England and Wales (Crime Survey for England and Wales) · Updated 7 November 2026
- crimes recorded in the year · 2002–03 to 2025-07 to 2026-06 · Source: Home Office, police recorded crime (published by the ONS) · Updated 7 November 2026
- crimes recorded in the year · 2002–03 to 2025-07 to 2026-06 · Source: Home Office, police recorded crime (published by the ONS) · Updated 7 November 2026
Benefits and the state pension
(18)
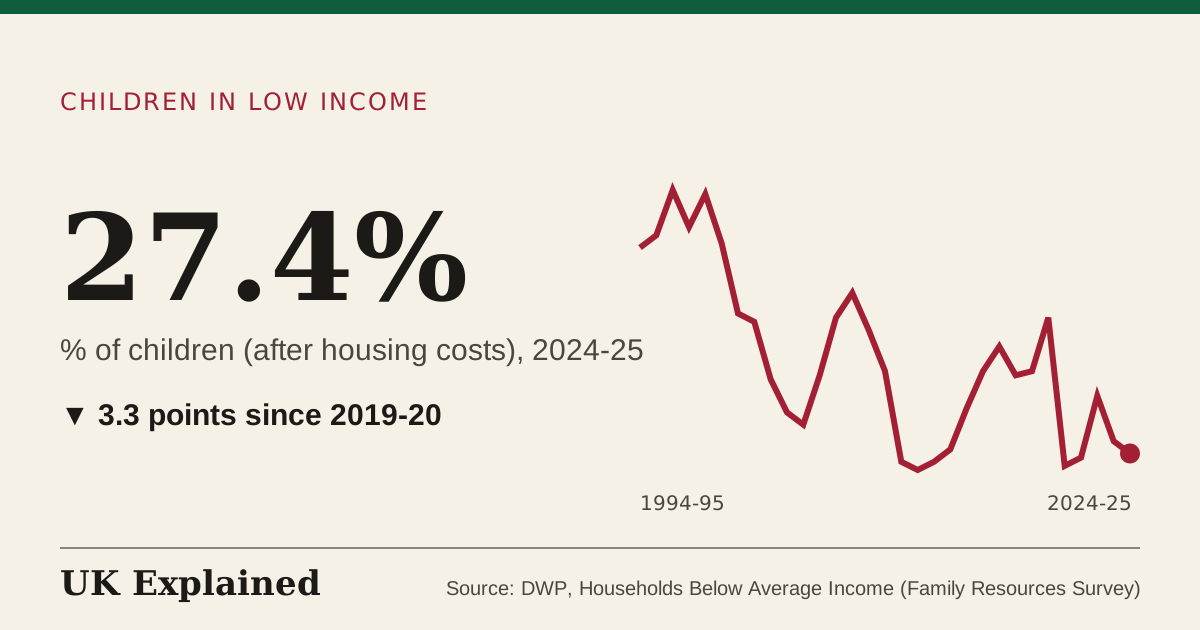
- % of children (after housing costs) · 1994–95 to 2024–25 · Source: DWP, Households Below Average Income (Family Resources Survey) · Updated 7 November 2026
- % of people aged 16 to 64 · January 1990 to September 2026 · Source: ONS · Updated 7 November 2026
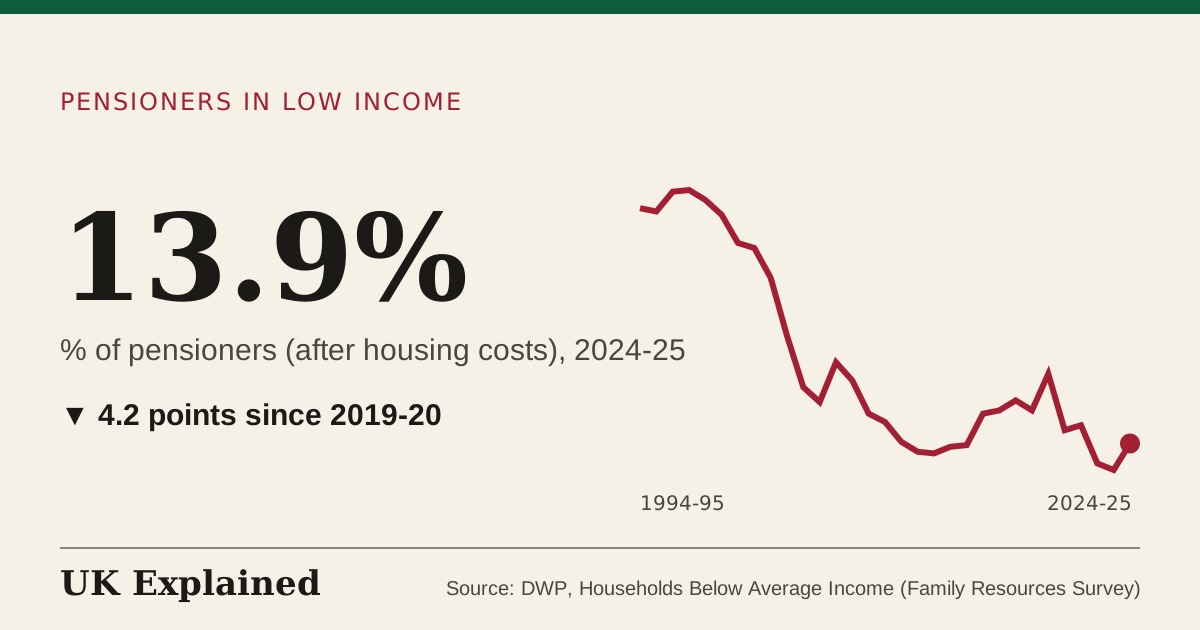
- % of pensioners (after housing costs) · 1994–95 to 2024–25 · Source: DWP, Households Below Average Income (Family Resources Survey) · Updated 7 November 2026
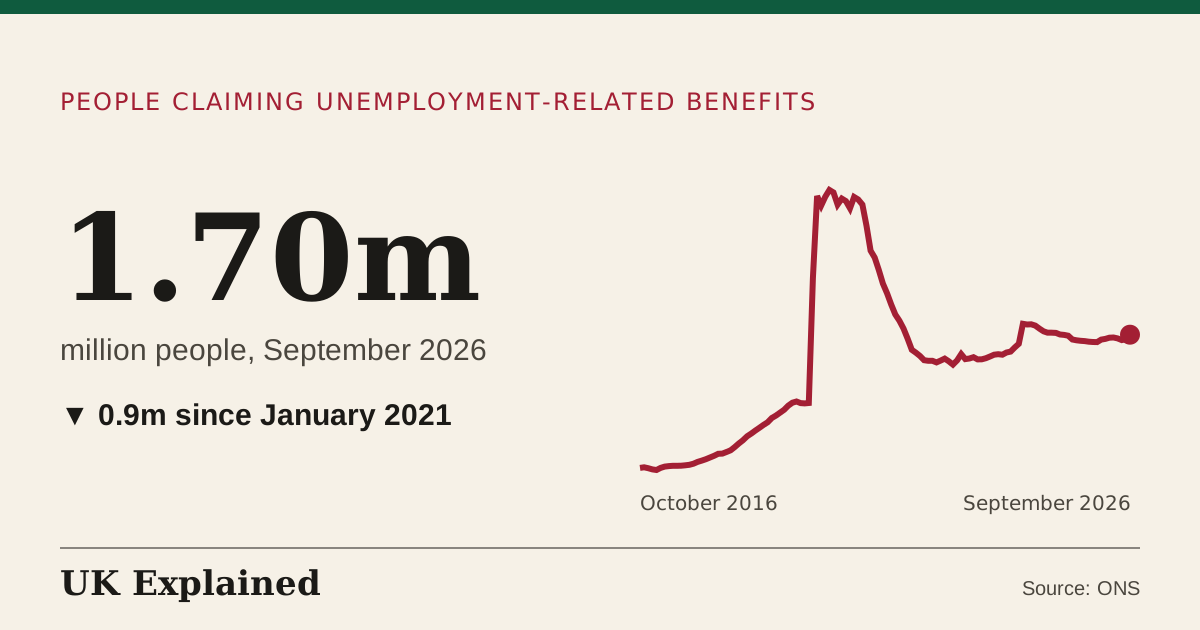
- million people · January 1990 to September 2026 · Source: ONS · Updated 7 November 2026
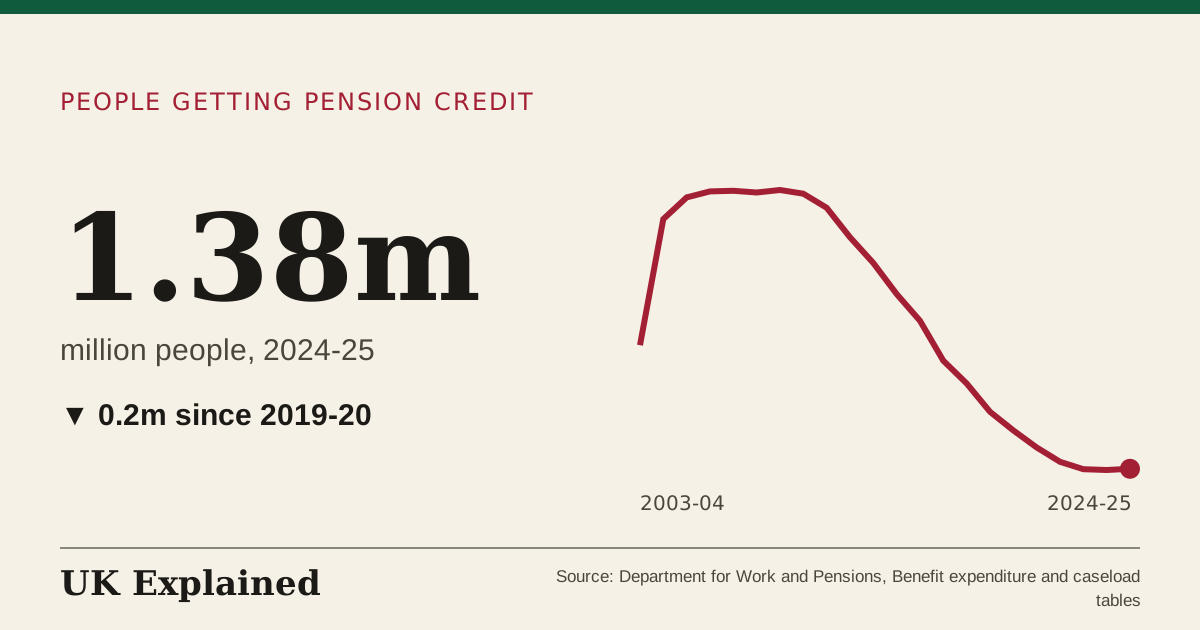
- million people · 2003–04 to 2024–25 · Source: Department for Work and Pensions, Benefit expenditure and caseload tables · Updated 7 November 2026
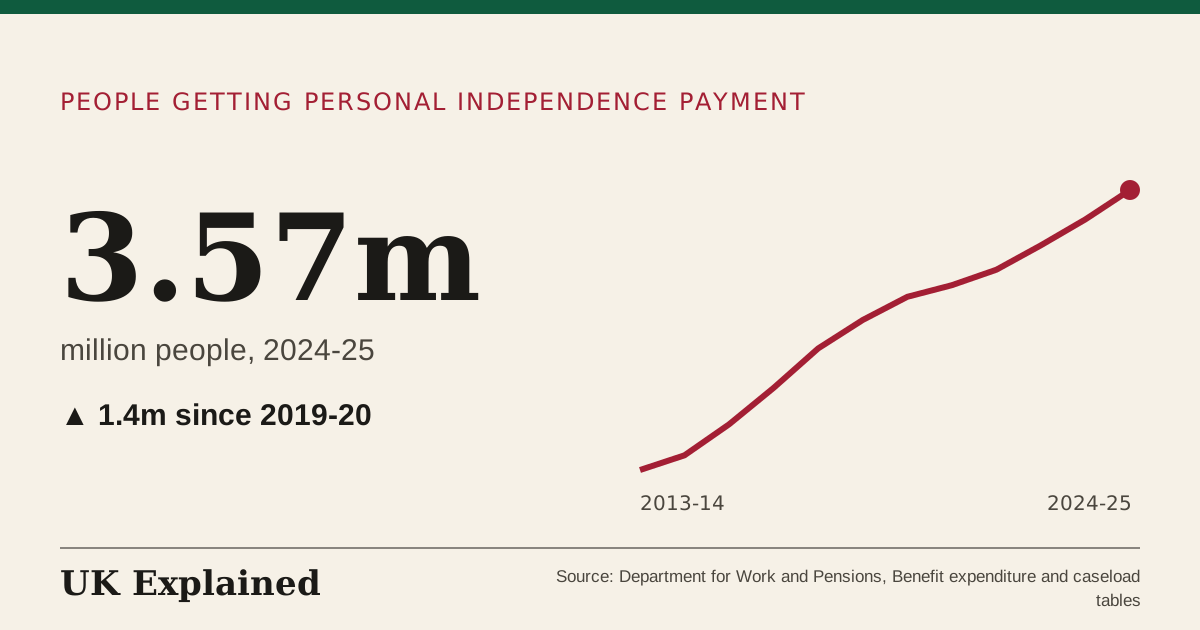
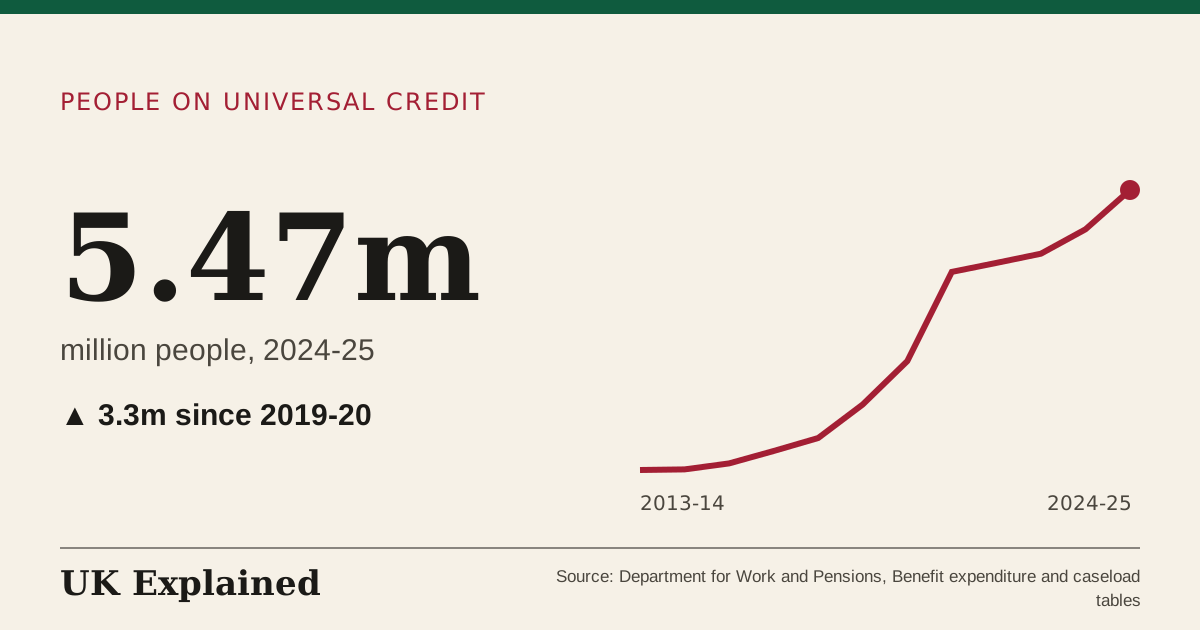
- million people · 2013–14 to 2024–25 · Source: Department for Work and Pensions, Benefit expenditure and caseload tables · Updated 7 November 2026
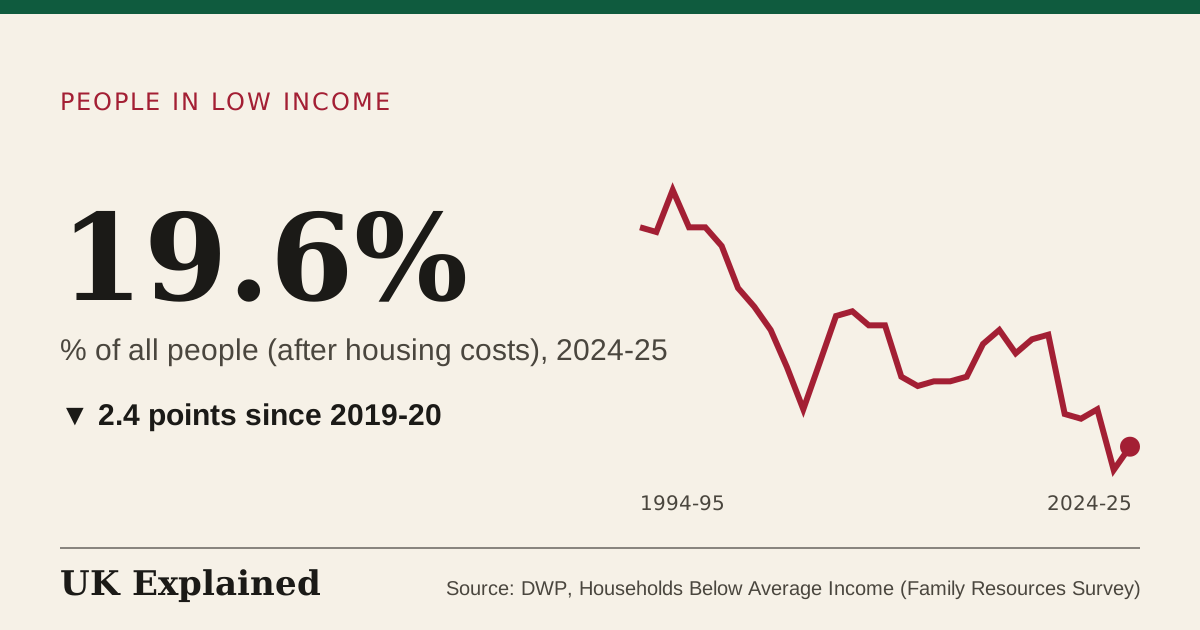
- % of all people (after housing costs) · 1994–95 to 2024–25 · Source: DWP, Households Below Average Income (Family Resources Survey) · Updated 7 November 2026
- million people · 2013–14 to 2024–25 · Source: Department for Work and Pensions, Benefit expenditure and caseload tables · Updated 7 November 2026
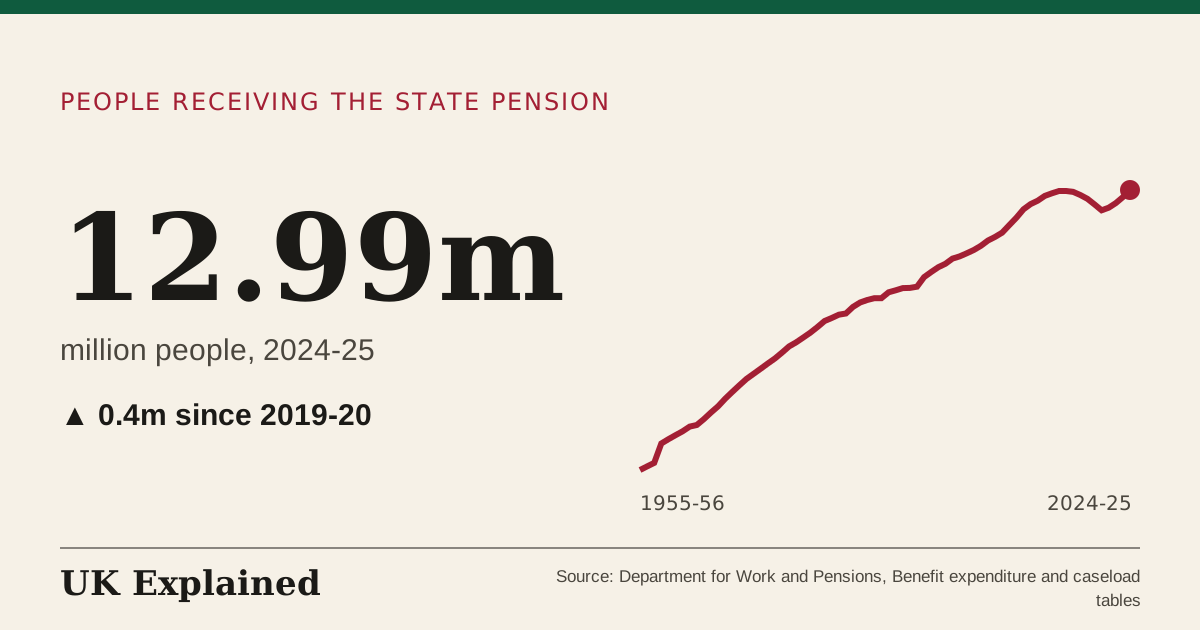
- million people · 1955–56 to 2024–25 · Source: Department for Work and Pensions, Benefit expenditure and caseload tables · Updated 7 November 2026
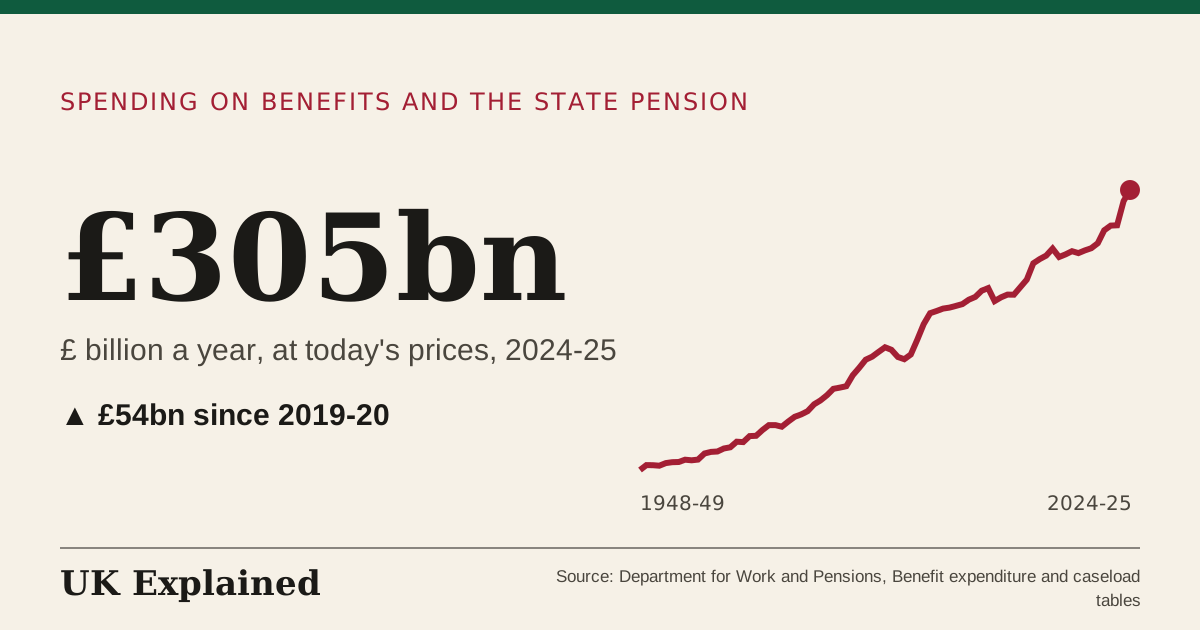
- £ billion a year, at today's prices · 1948–49 to 2024–25 · Source: Department for Work and Pensions, Benefit expenditure and caseload tables · Updated 7 November 2026
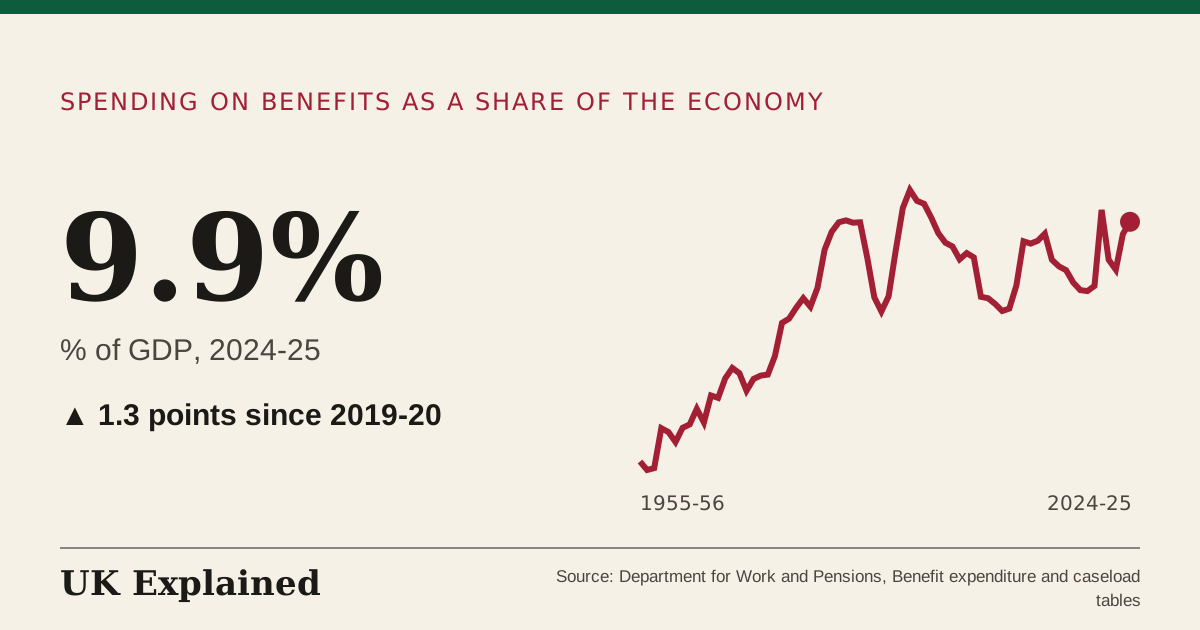
- % of GDP · 1955–56 to 2024–25 · Source: Department for Work and Pensions, Benefit expenditure and caseload tables · Updated 7 November 2026
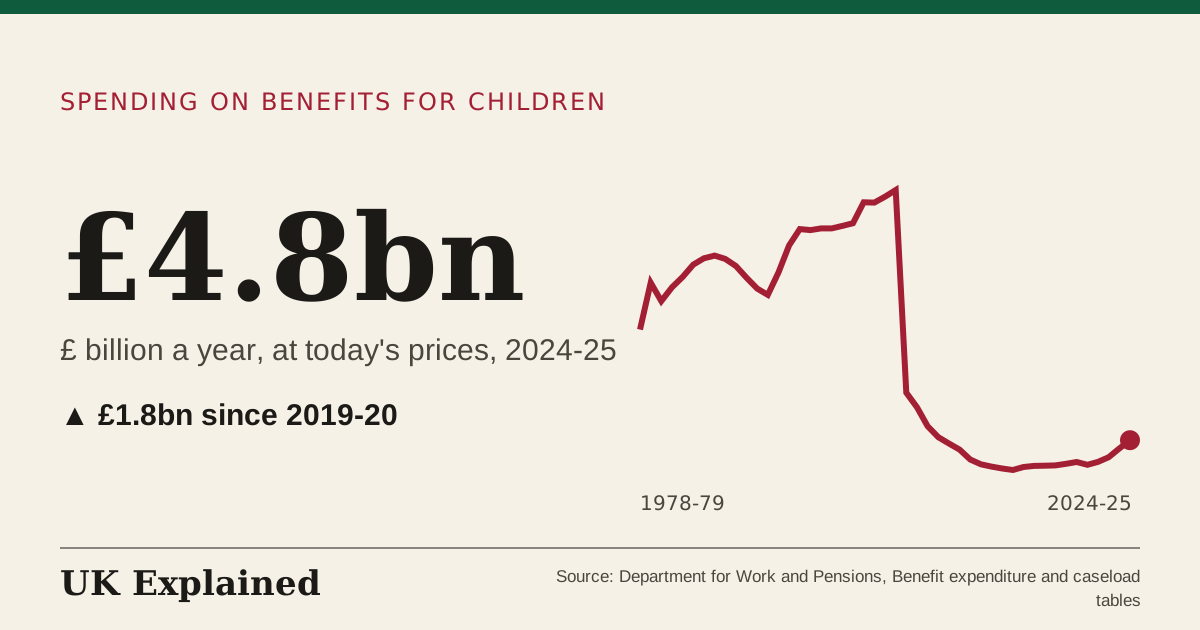
- £ billion a year, at today's prices · 1978–79 to 2024–25 · Source: Department for Work and Pensions, Benefit expenditure and caseload tables · Updated 7 November 2026
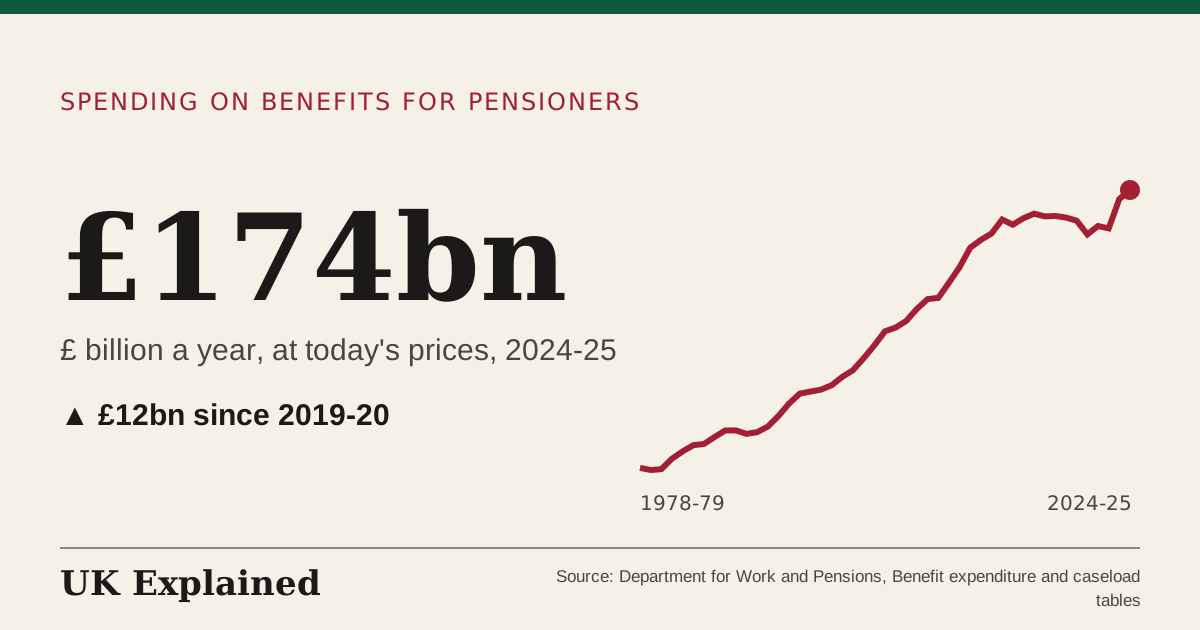
- £ billion a year, at today's prices · 1978–79 to 2024–25 · Source: Department for Work and Pensions, Benefit expenditure and caseload tables · Updated 7 November 2026
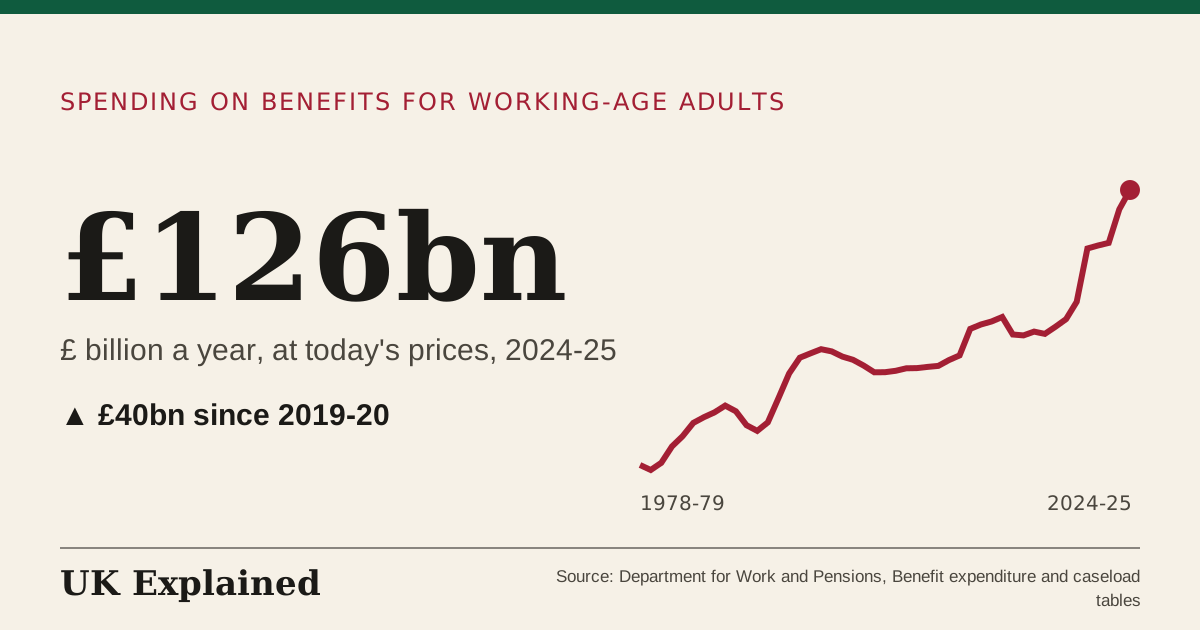
- £ billion a year, at today's prices · 1978–79 to 2024–25 · Source: Department for Work and Pensions, Benefit expenditure and caseload tables · Updated 7 November 2026
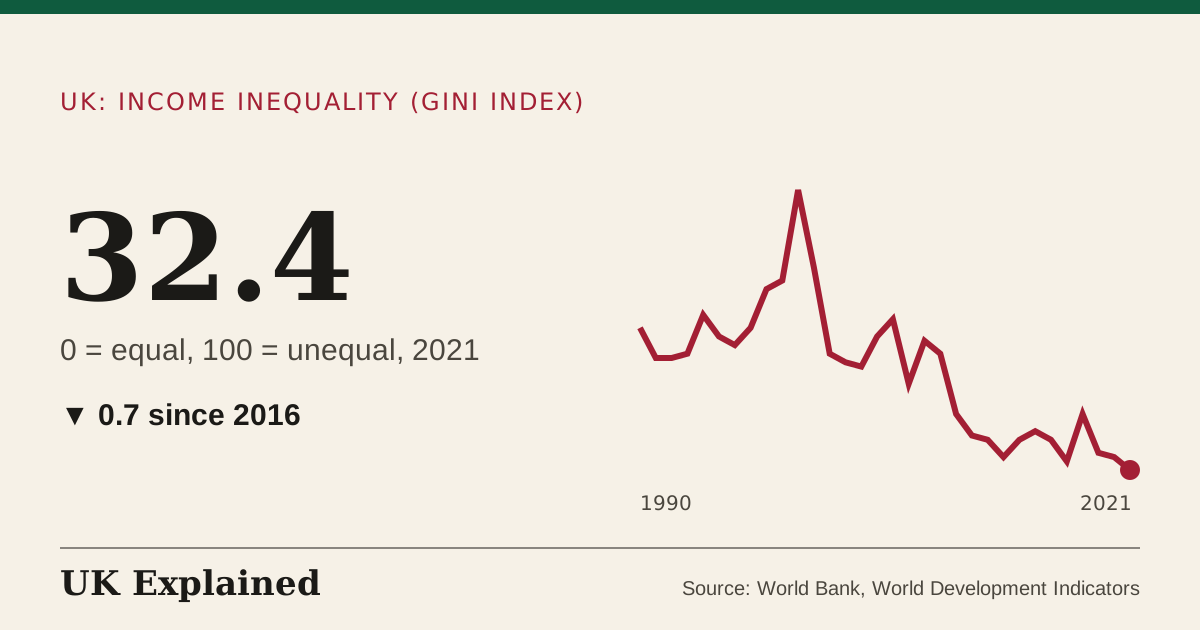
- 0 = equal, 100 = unequal · 1990 to 2021 · Source: World Bank, World Development Indicators · Updated 7 November 2026
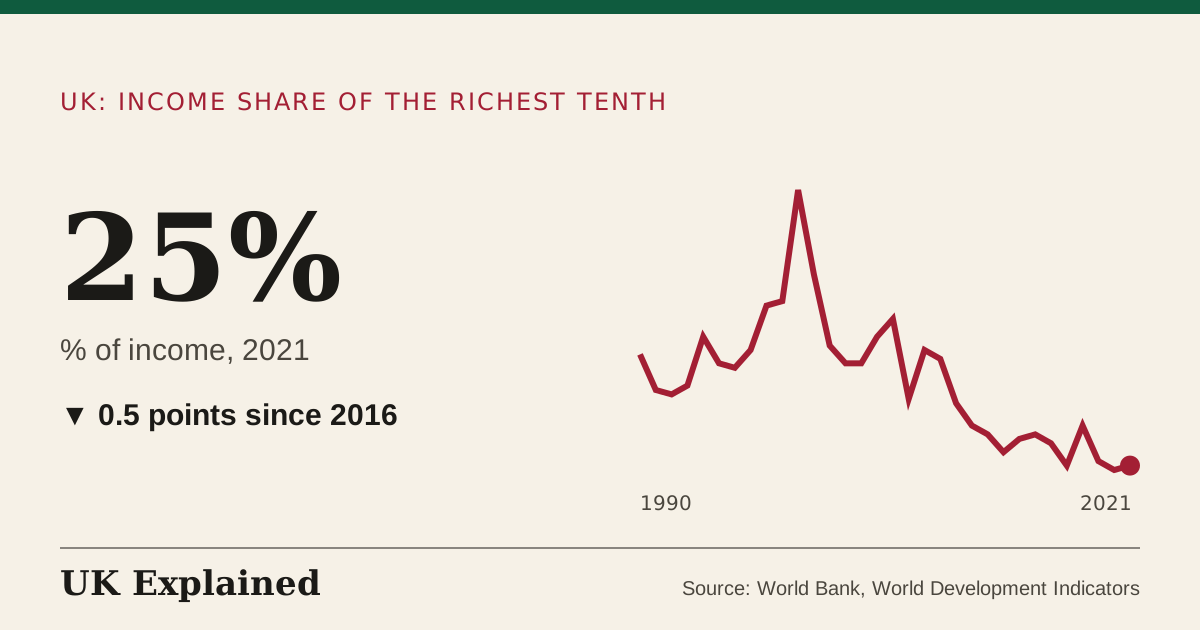
- % of income · 1990 to 2021 · Source: World Bank, World Development Indicators · Updated 7 November 2026
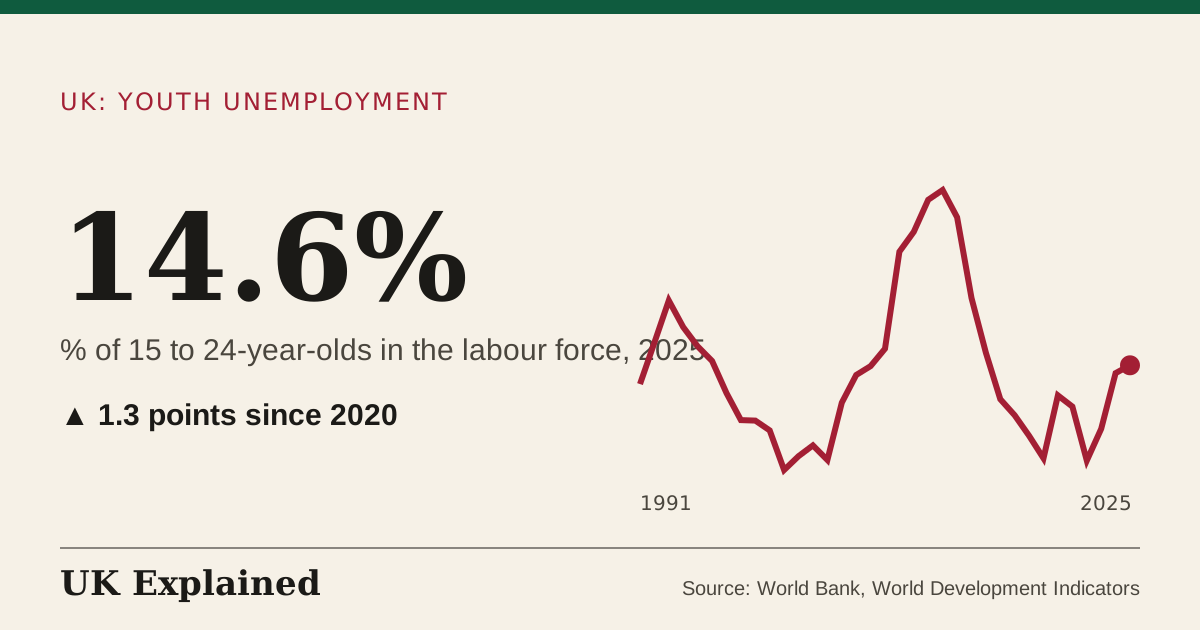
- % of 15 to 24-year-olds in the labour force · 1991 to 2025 · Source: World Bank, World Development Indicators · Updated 7 November 2026
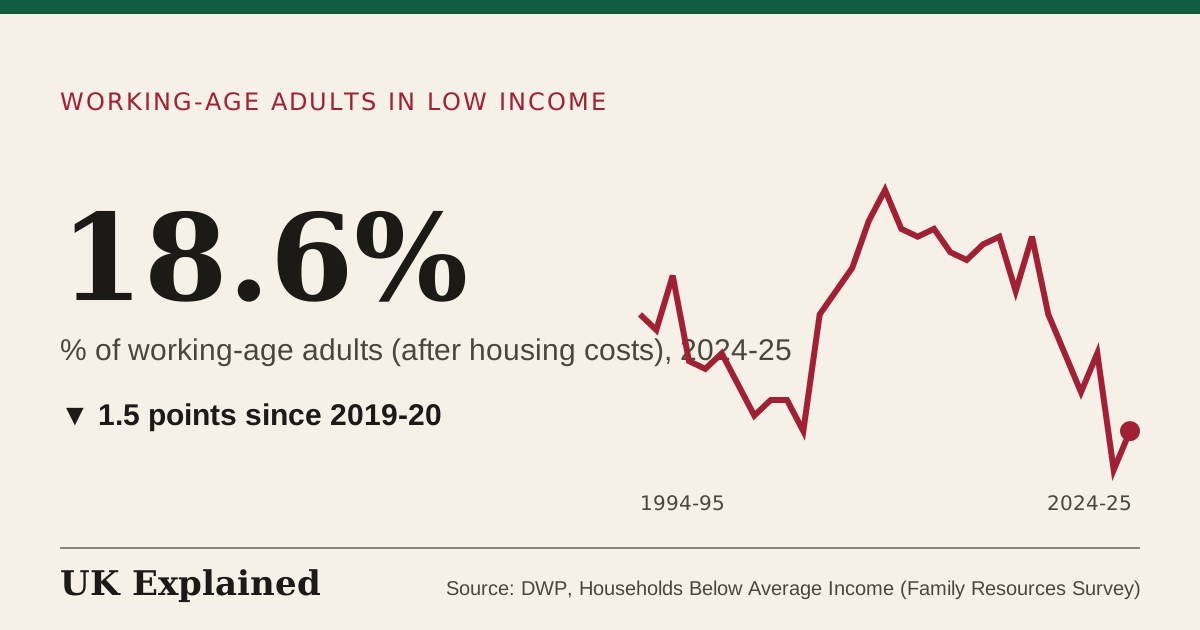
- % of working-age adults (after housing costs) · 1994–95 to 2024–25 · Source: DWP, Households Below Average Income (Family Resources Survey) · Updated 7 November 2026
Transport
(22)
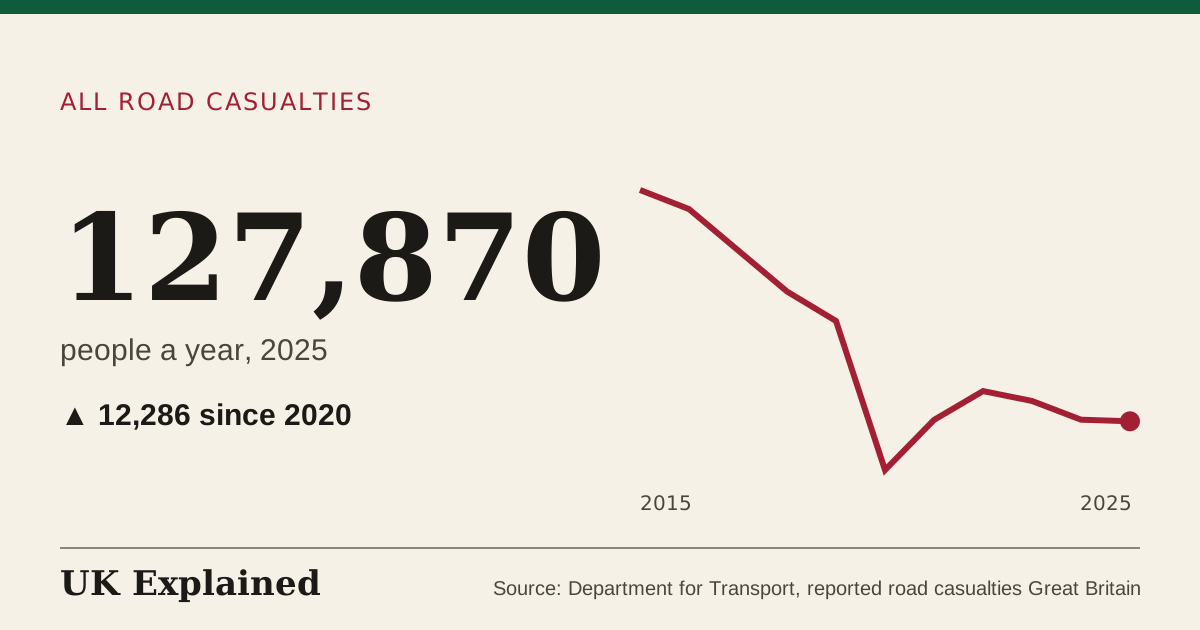
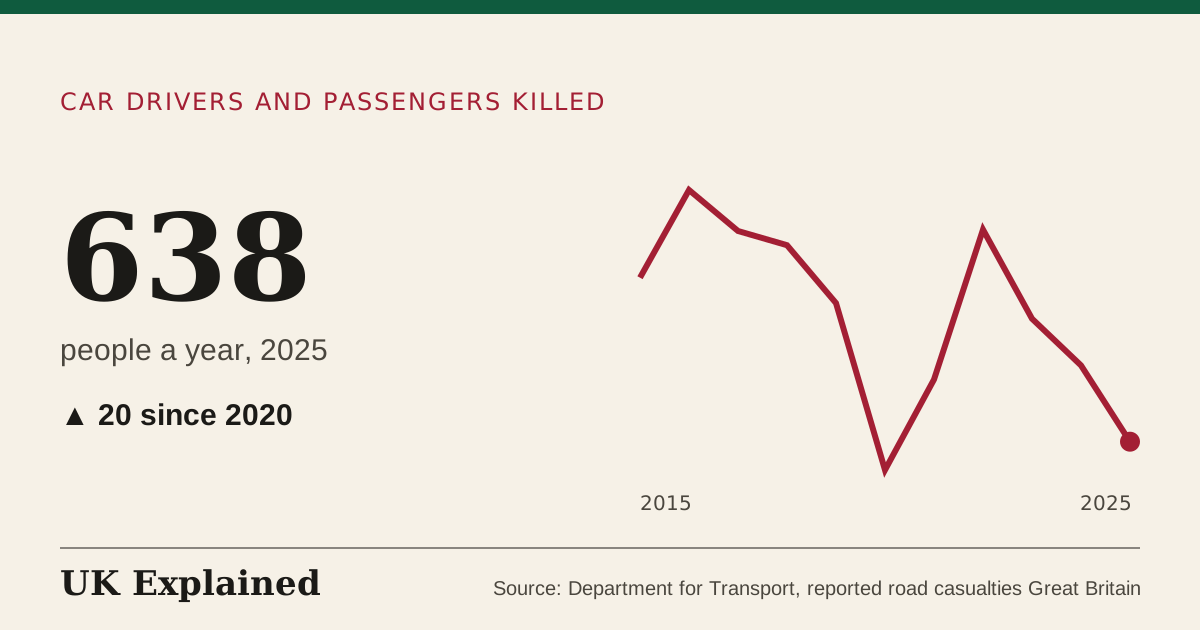
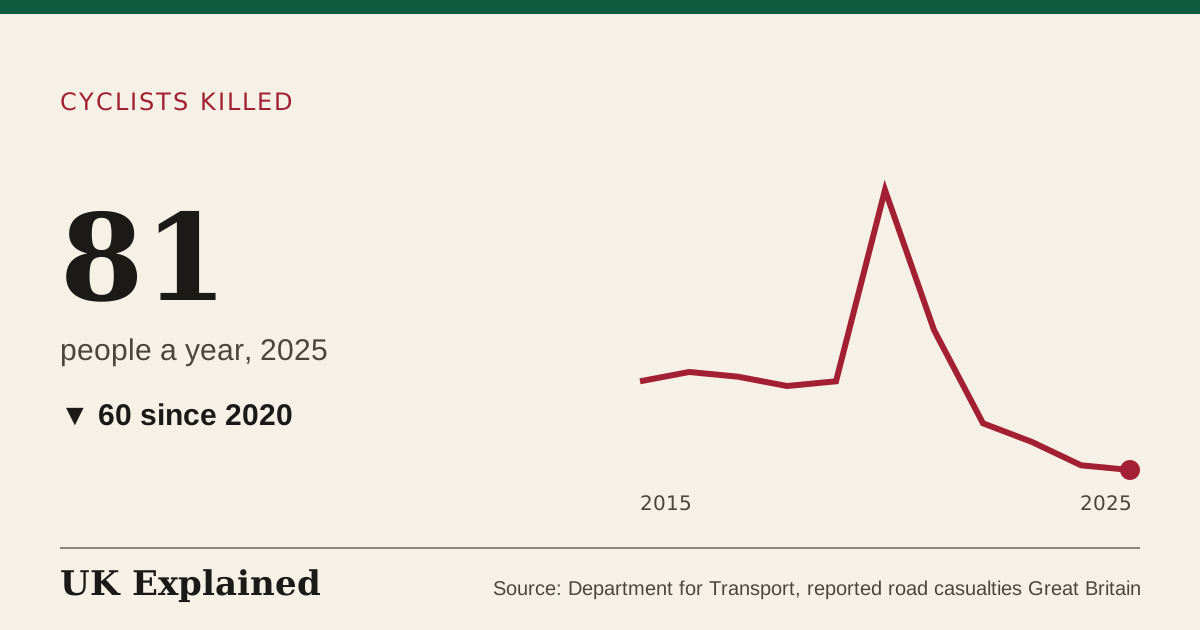
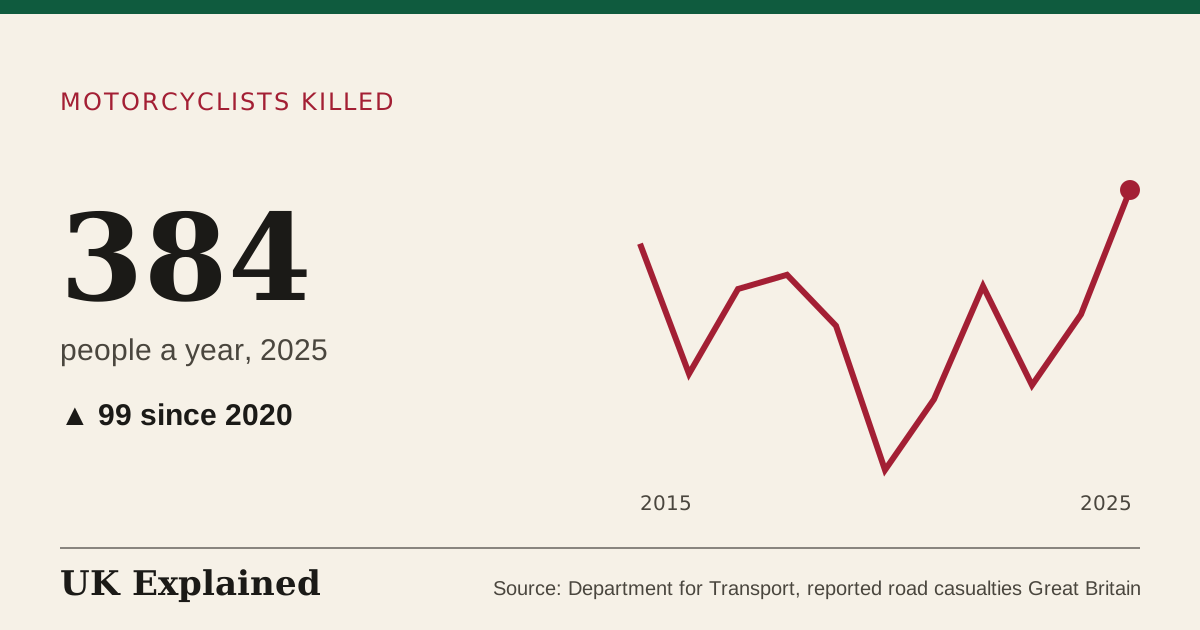
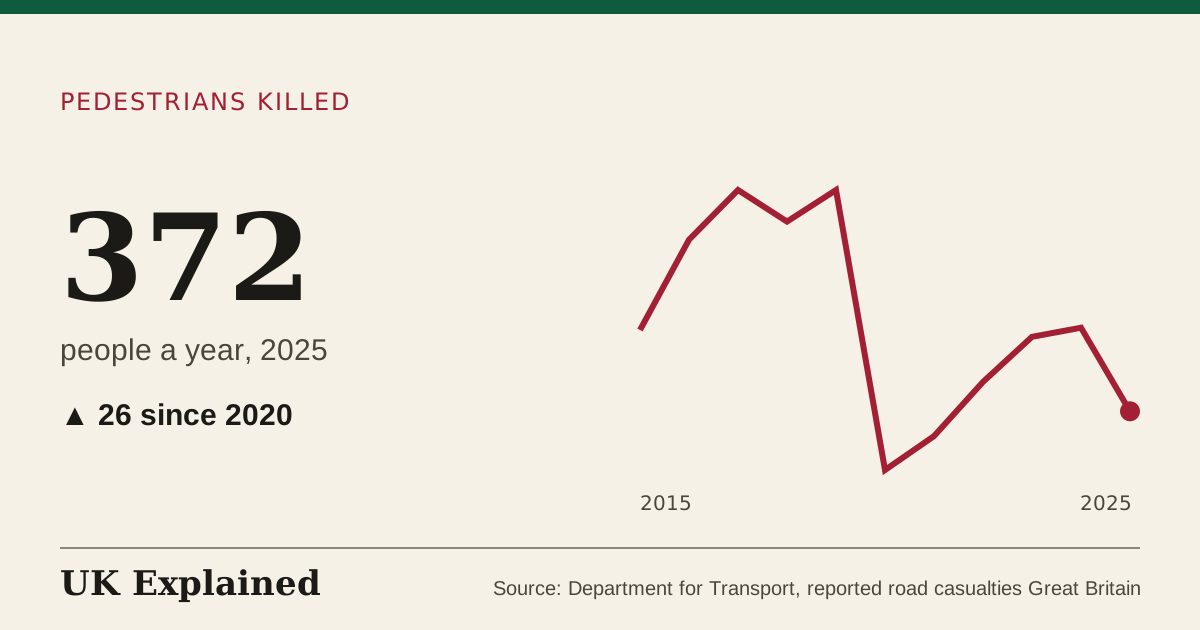
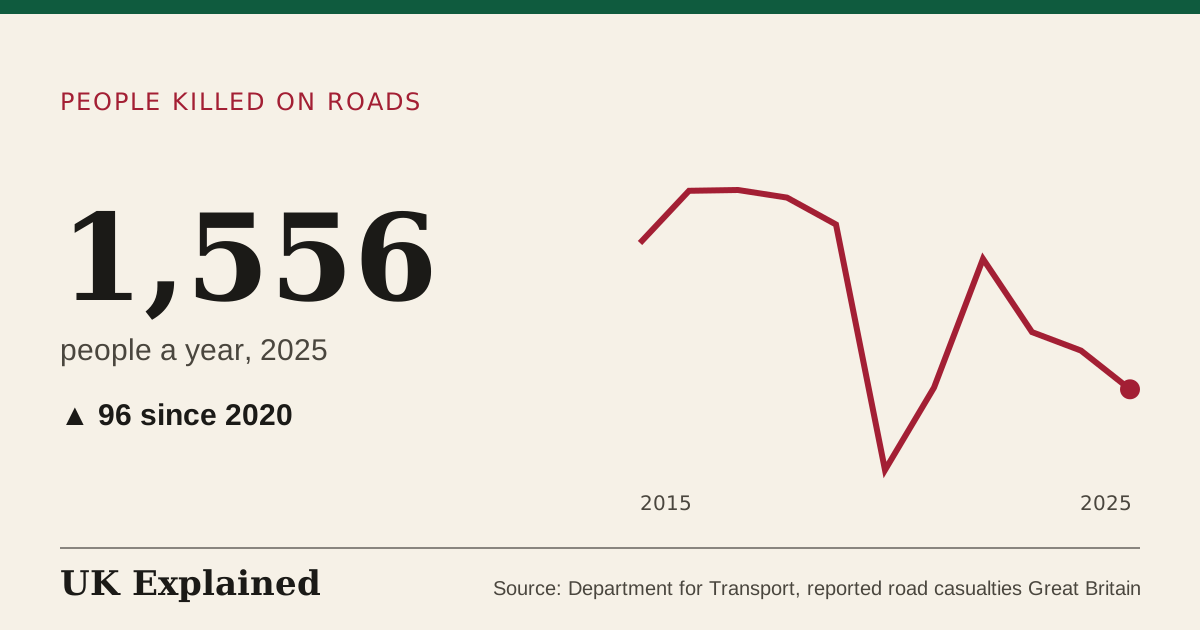
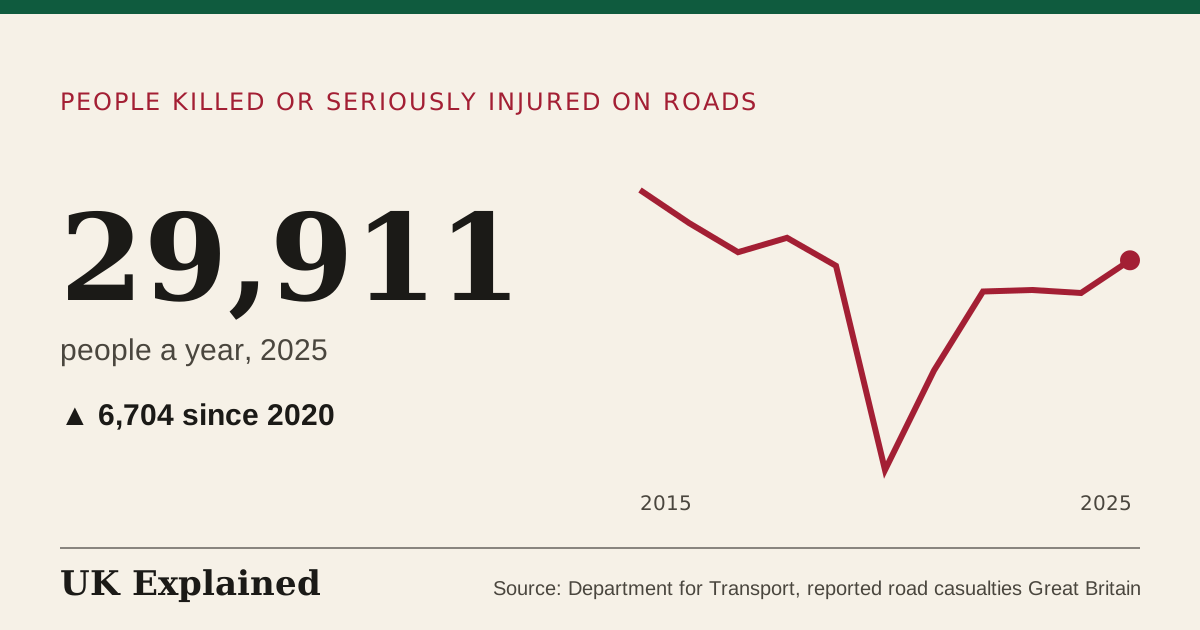
- people a year · 2015 to 2025 · Source: Department for Transport, reported road casualties Great Britain · Updated 7 November 2026
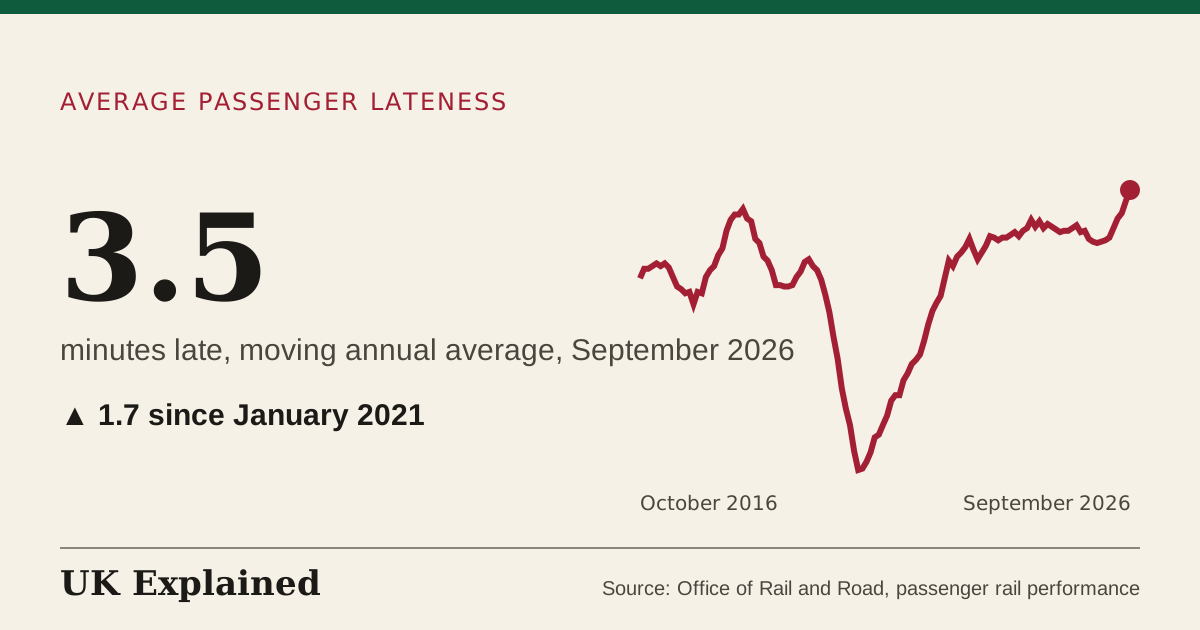
- minutes late, moving annual average · April 2010 to September 2026 · Source: Office of Rail and Road, passenger rail performance · Updated 7 November 2026
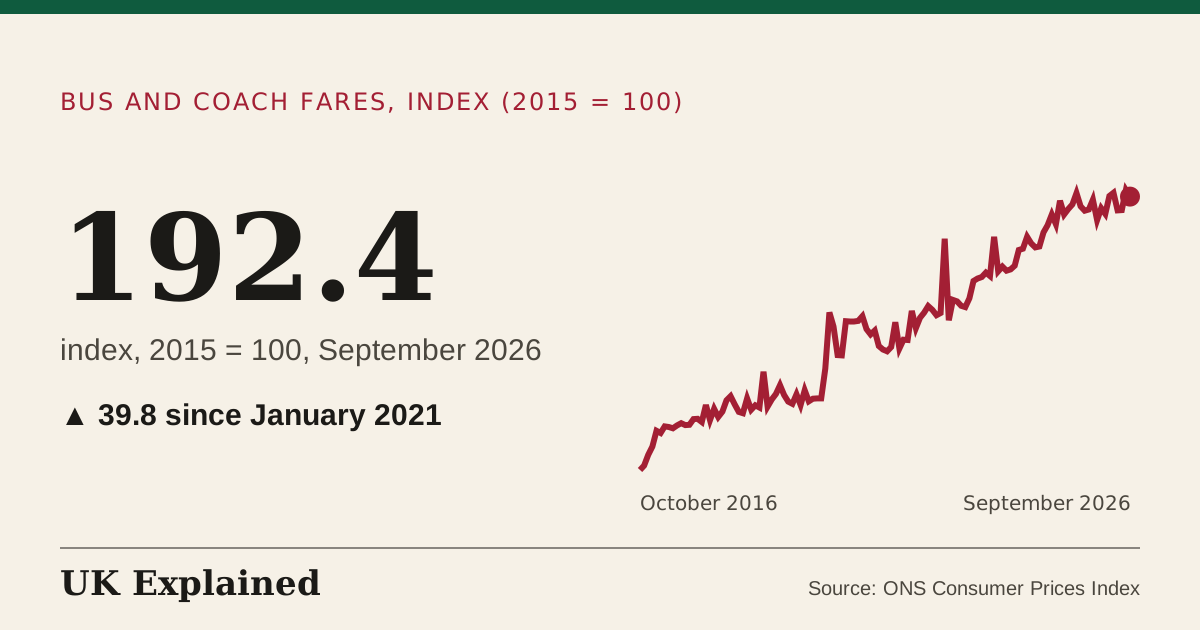
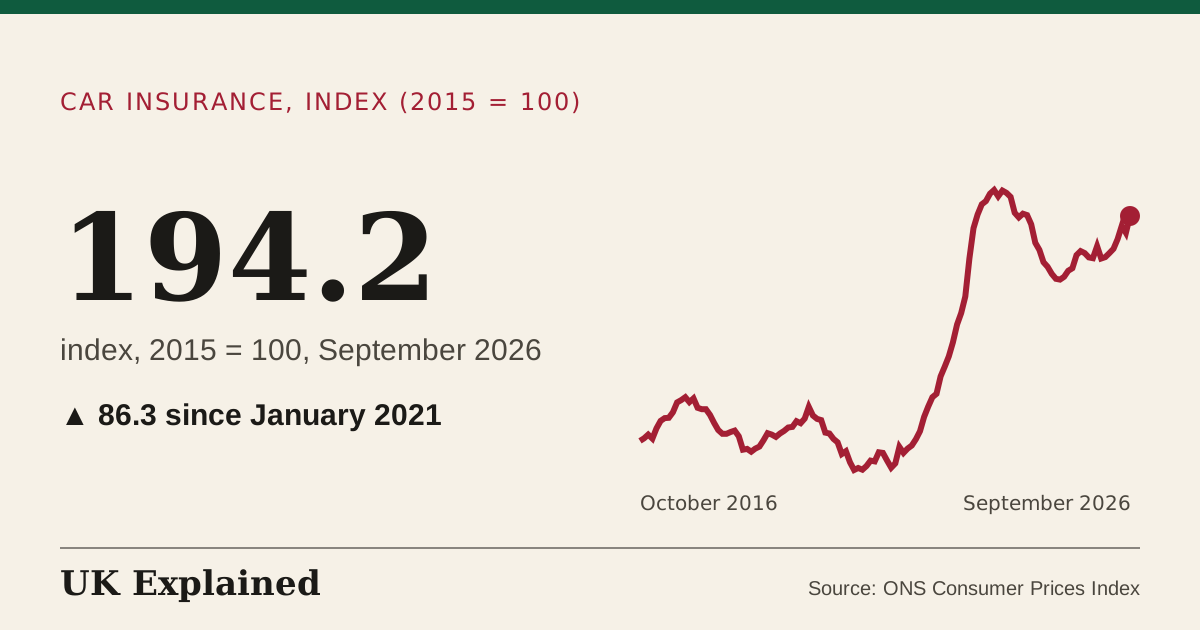
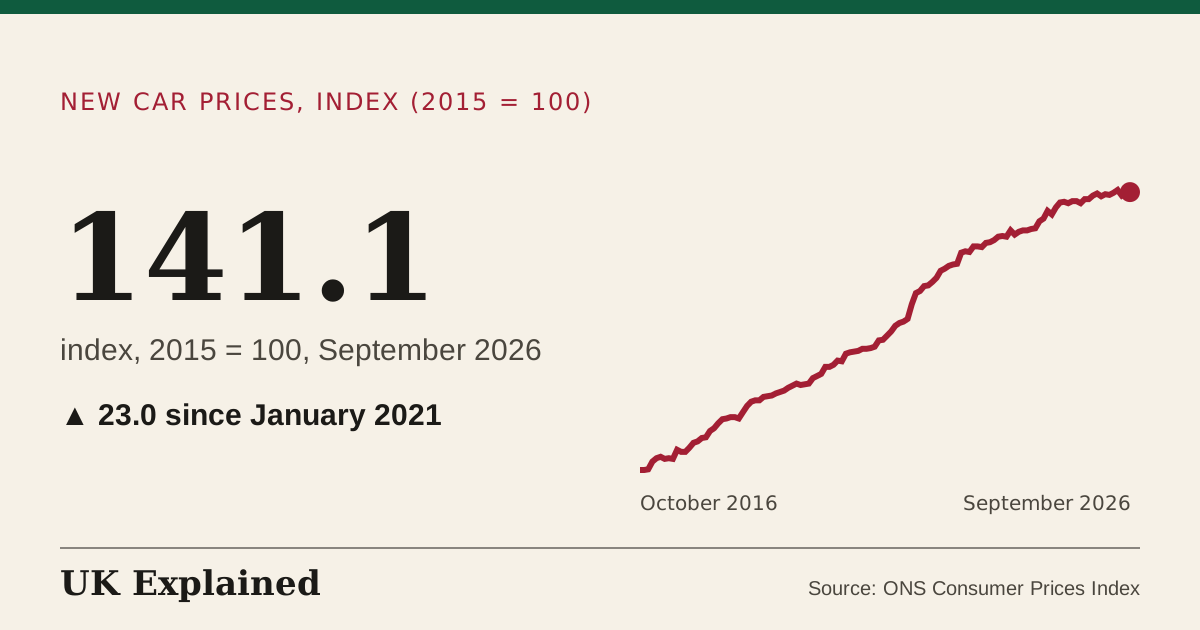
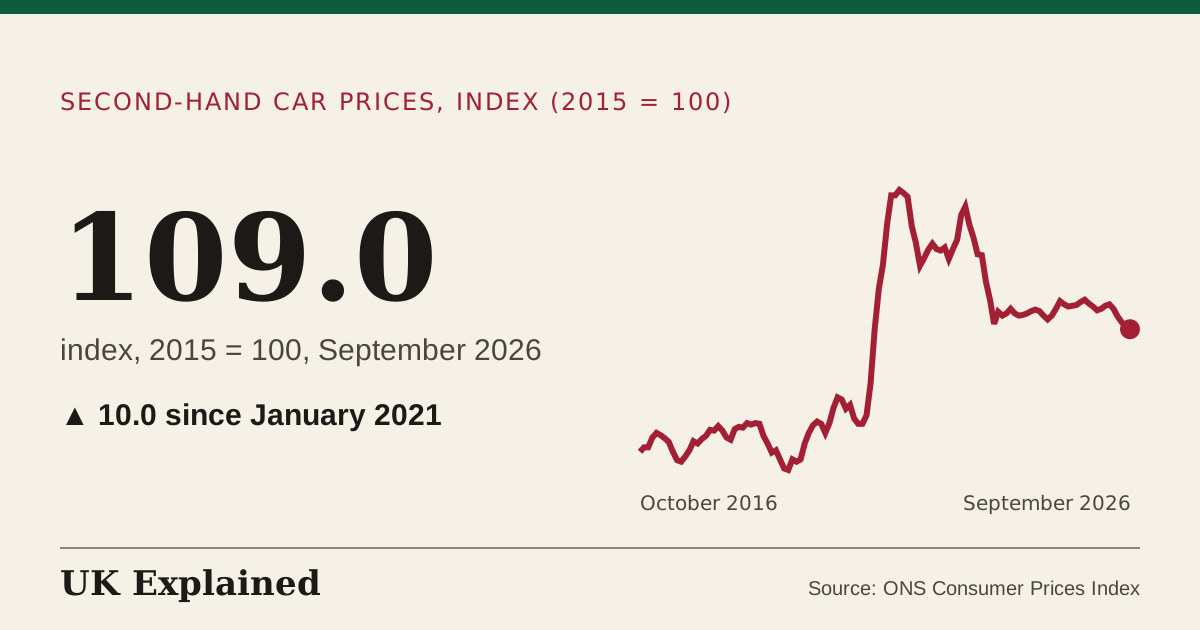
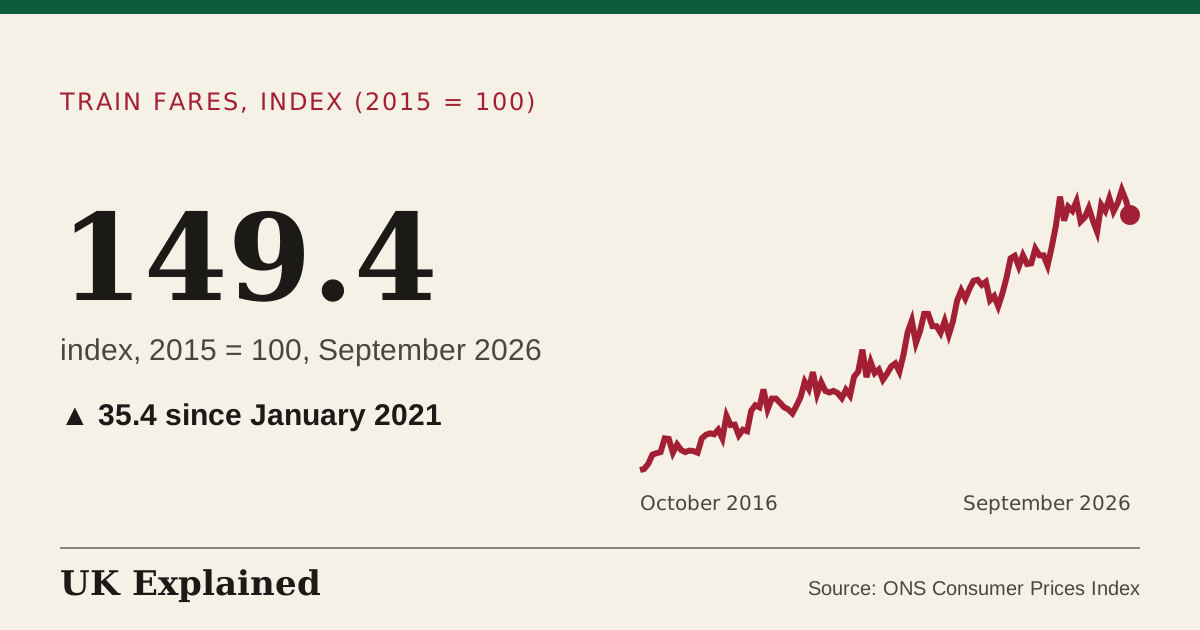
- index, 2015 = 100 · January 2015 to September 2026 · Source: ONS Consumer Prices Index · Updated 7 November 2026
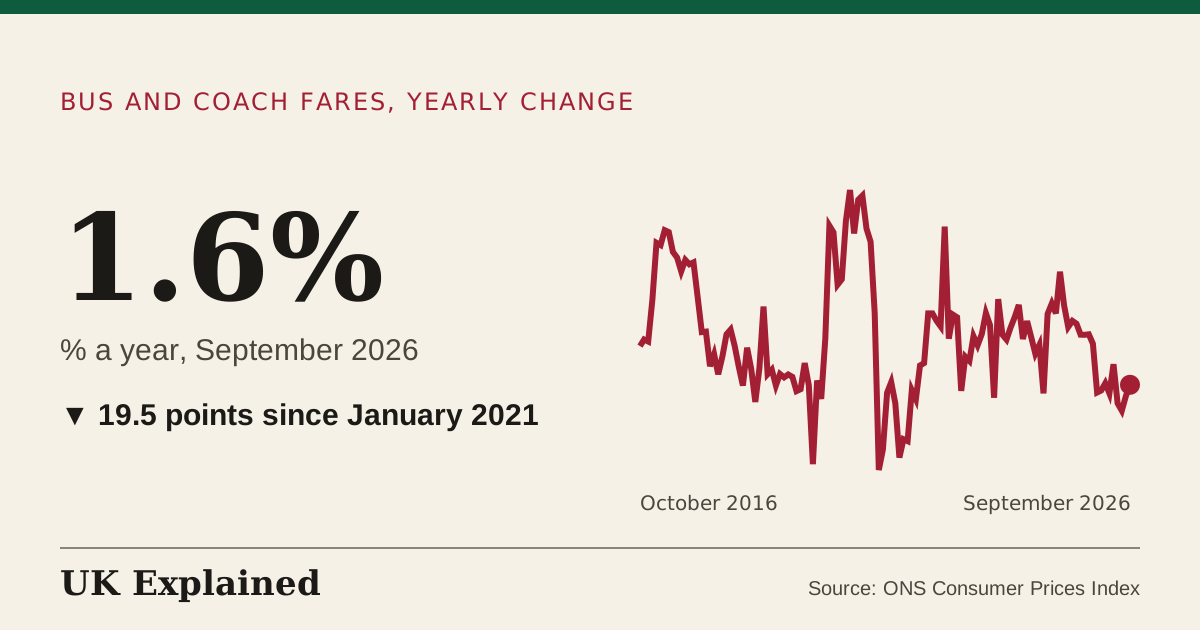
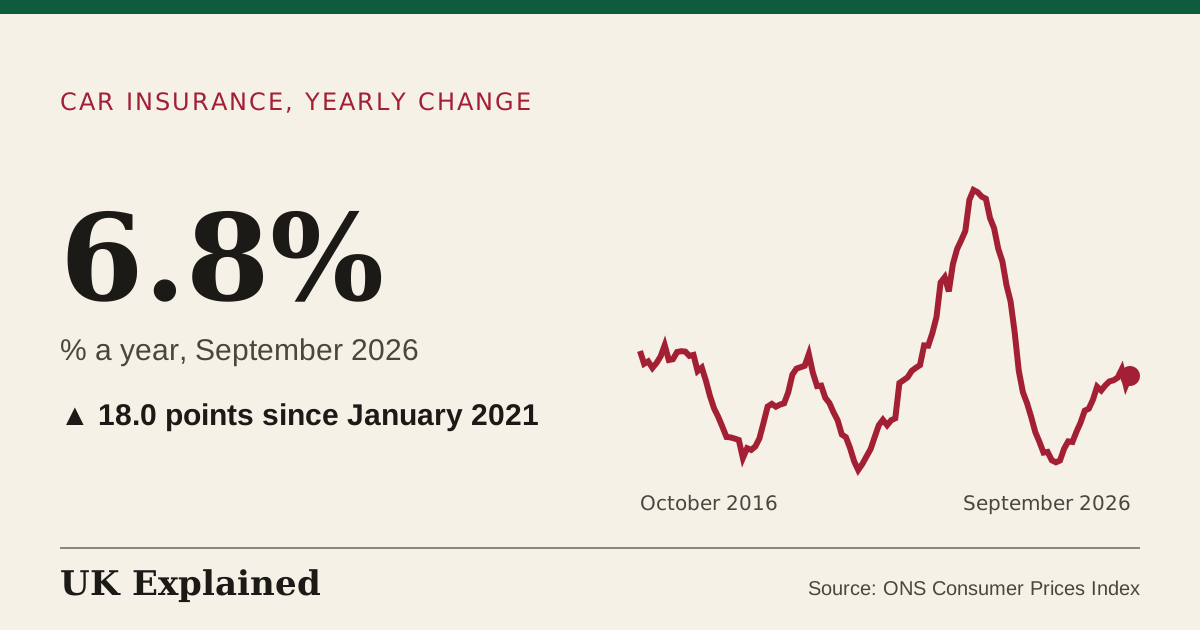
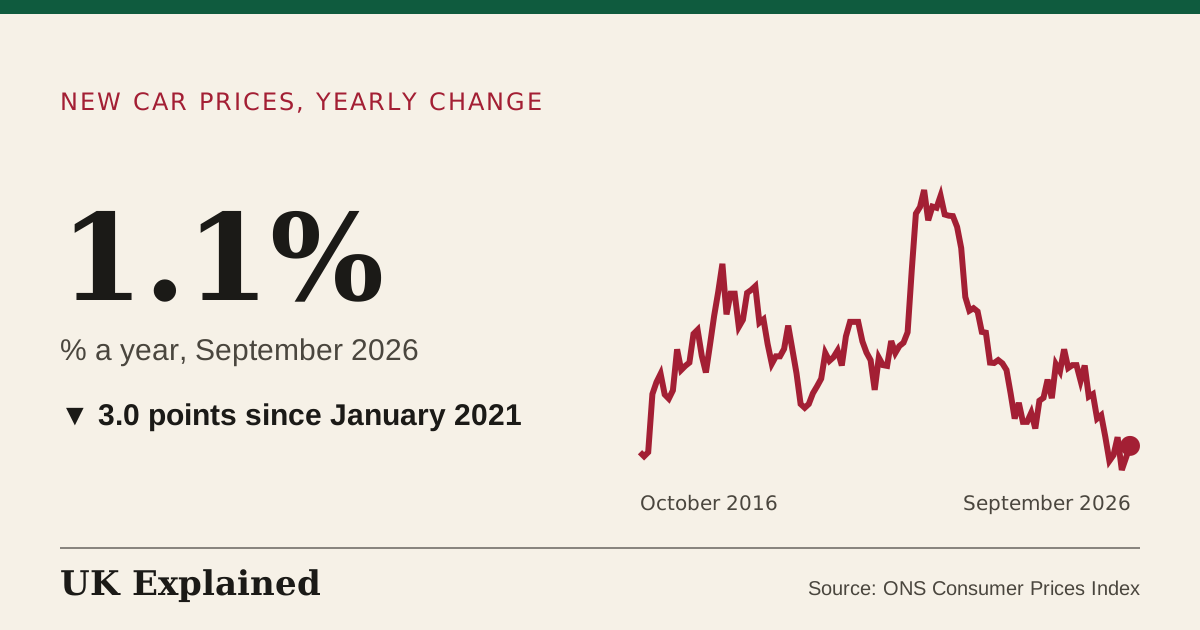
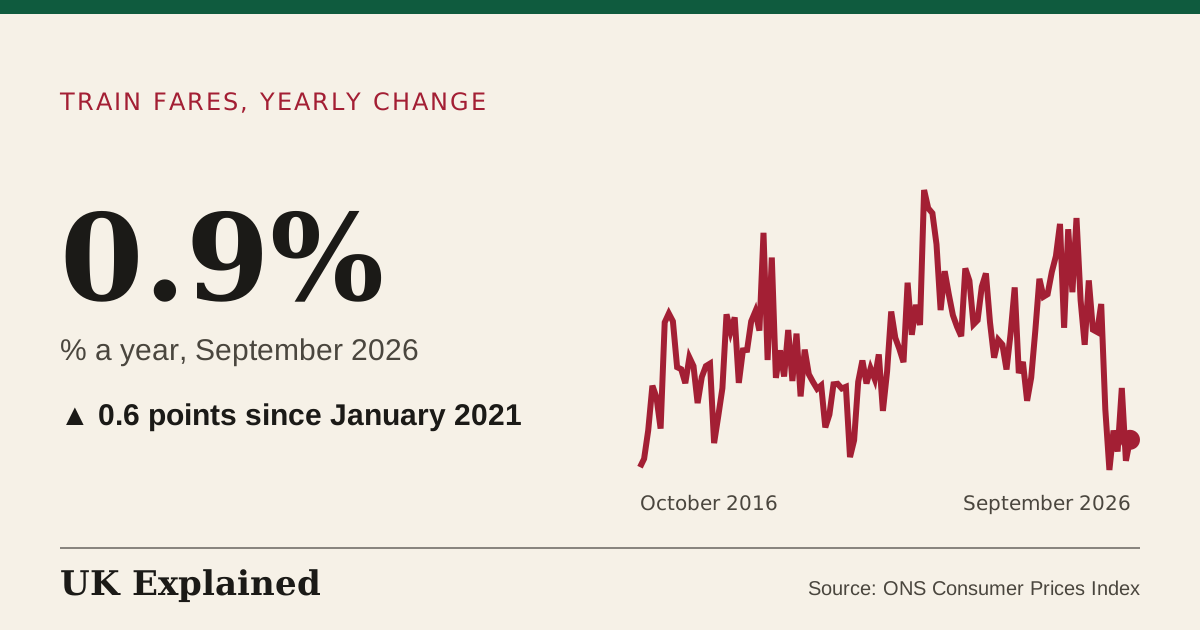
- % a year · January 2016 to September 2026 · Source: ONS Consumer Prices Index · Updated 7 November 2026
- people a year · 2015 to 2025 · Source: Department for Transport, reported road casualties Great Britain · Updated 7 November 2026
- index, 2015 = 100 · January 2015 to September 2026 · Source: ONS Consumer Prices Index · Updated 7 November 2026
- % a year · January 2016 to September 2026 · Source: ONS Consumer Prices Index · Updated 7 November 2026
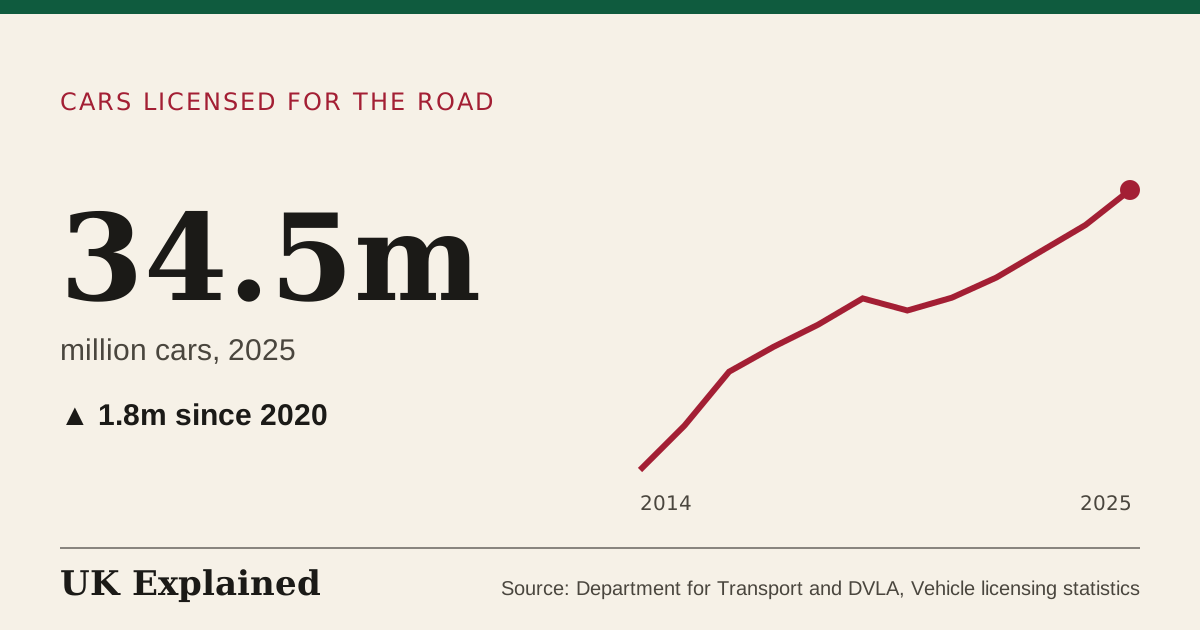
- million cars · 2014 to 2025 · Source: Department for Transport and DVLA, Vehicle licensing statistics · Updated 7 November 2026
- people a year · 2015 to 2025 · Source: Department for Transport, reported road casualties Great Britain · Updated 7 November 2026
- people a year · 2015 to 2025 · Source: Department for Transport, reported road casualties Great Britain · Updated 7 November 2026
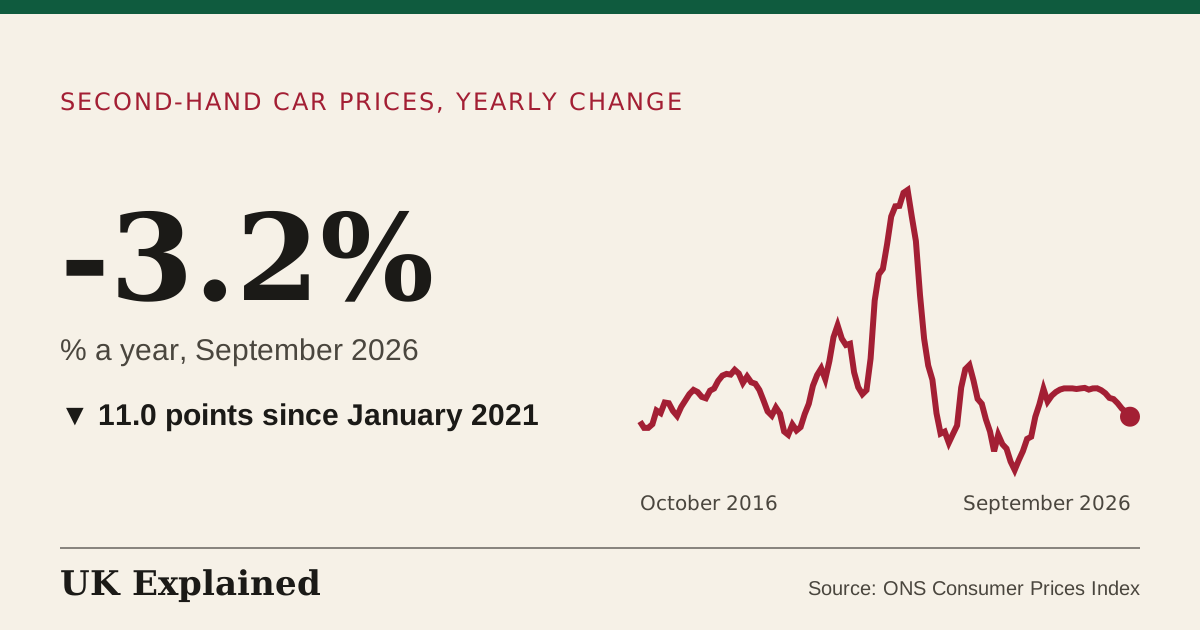
- index, 2015 = 100 · January 1998 to September 2026 · Source: ONS Consumer Prices Index · Updated 7 November 2026
- % a year · January 1998 to September 2026 · Source: ONS Consumer Prices Index · Updated 7 November 2026
- million cars a year · 2015 to 2025 · Source: Department for Transport and DVLA, Vehicle licensing statistics · Updated 7 November 2026
- people a year · 2015 to 2025 · Source: Department for Transport, reported road casualties Great Britain · Updated 7 November 2026
- people a year · 2015 to 2025 · Source: Department for Transport, reported road casualties Great Britain · Updated 7 November 2026
- people a year · 2015 to 2025 · Source: Department for Transport, reported road casualties Great Britain · Updated 7 November 2026
- index, 2015 = 100 · January 1998 to September 2026 · Source: ONS Consumer Prices Index · Updated 7 November 2026
- % a year · January 1998 to September 2026 · Source: ONS Consumer Prices Index · Updated 7 November 2026
- index, 2015 = 100 · January 2015 to September 2026 · Source: ONS Consumer Prices Index · Updated 7 November 2026
- % a year · January 2016 to September 2026 · Source: ONS Consumer Prices Index · Updated 7 November 2026
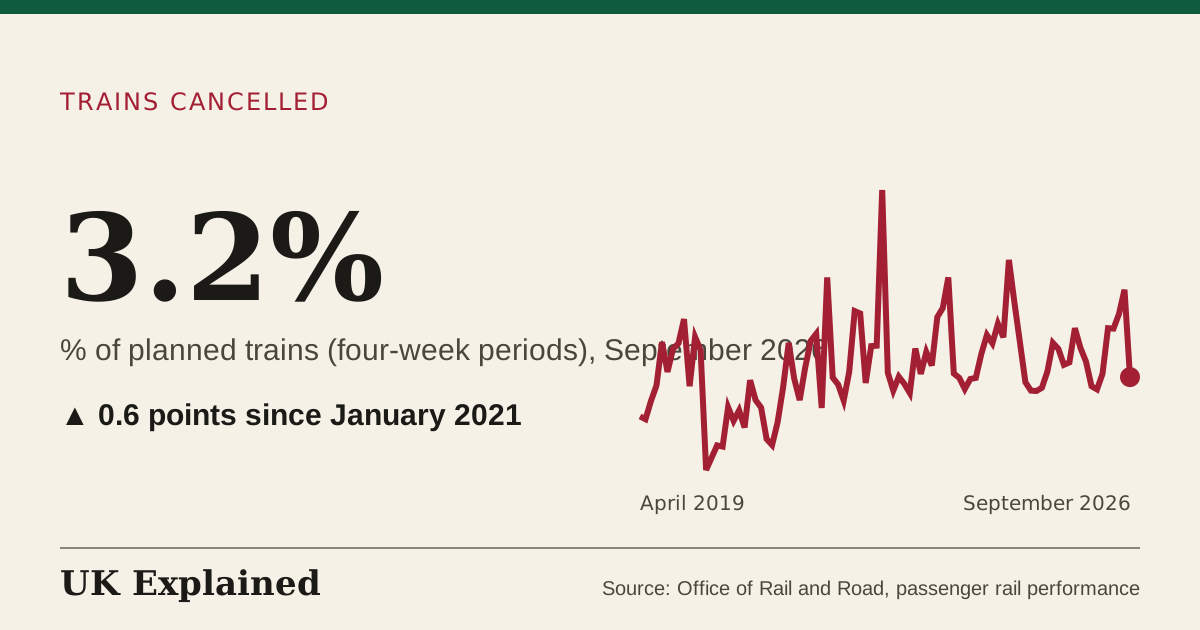
- % of planned trains (four-week periods) · April 2019 to September 2026 · Source: Office of Rail and Road, passenger rail performance · Updated 7 November 2026
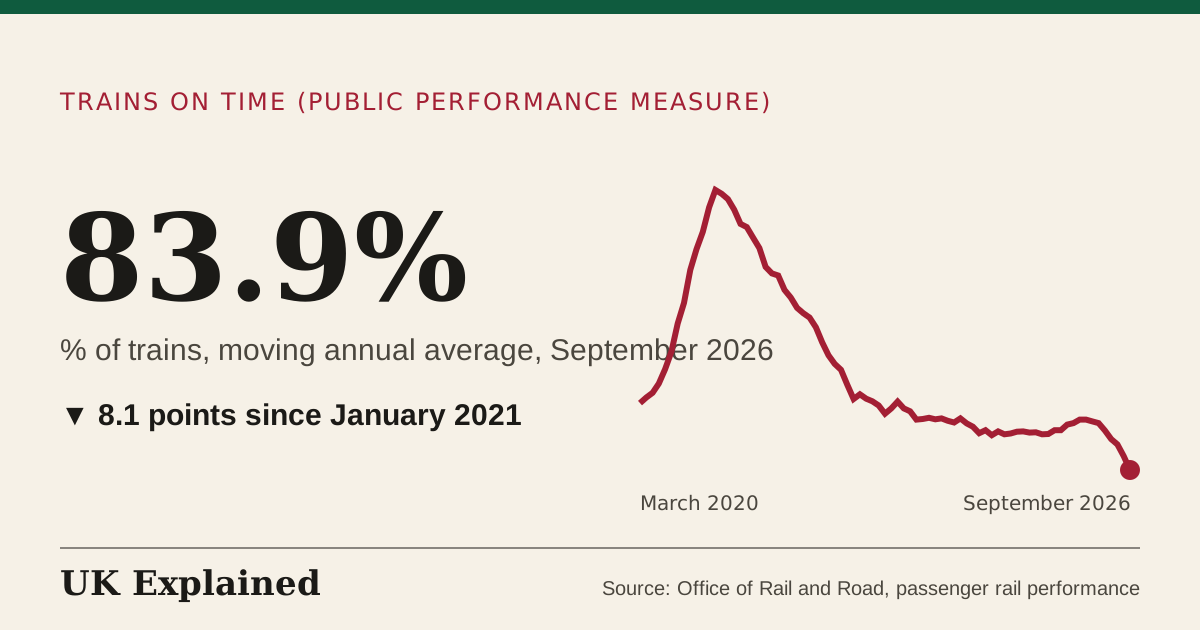
- % of trains, moving annual average · March 2020 to September 2026 · Source: Office of Rail and Road, passenger rail performance · Updated 7 November 2026

Environment
(29)
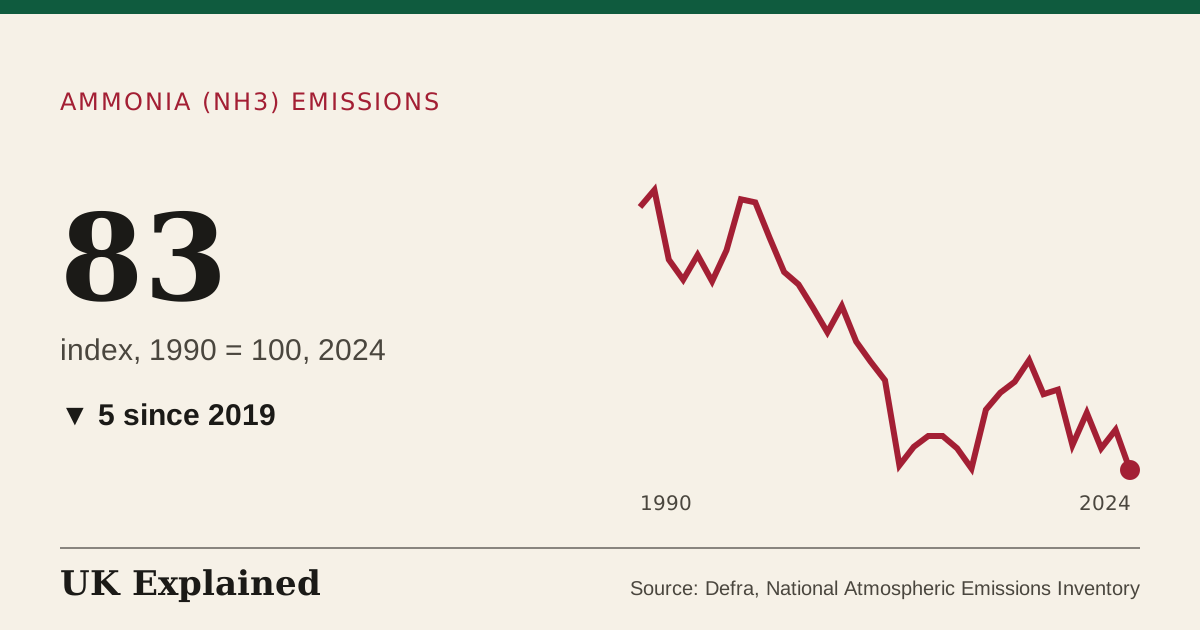
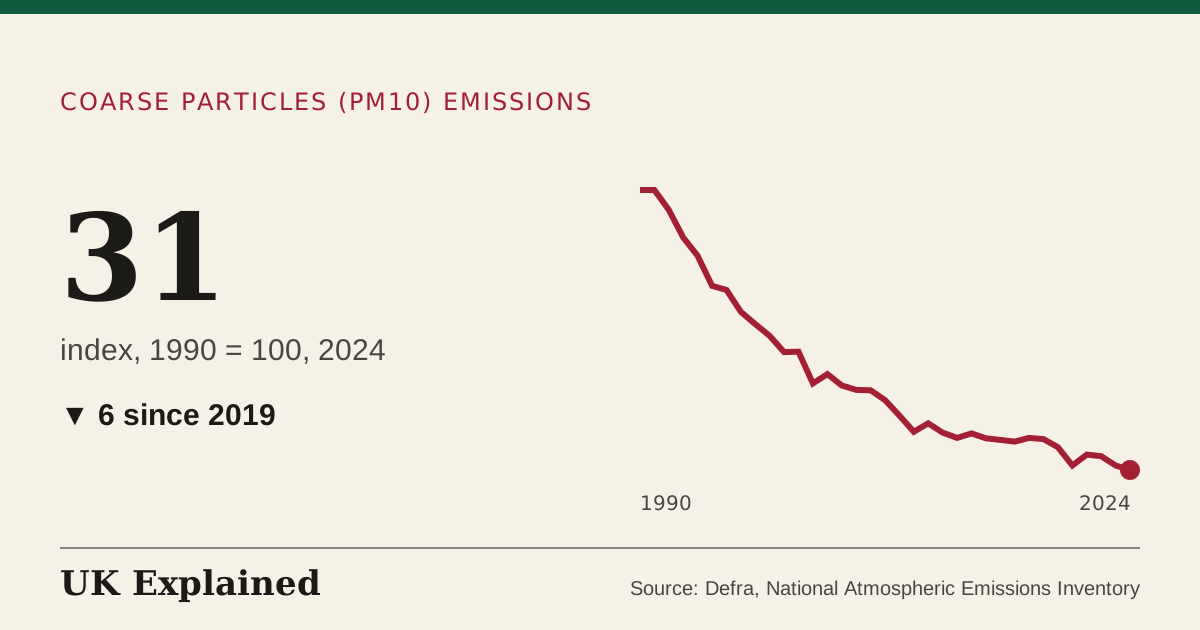
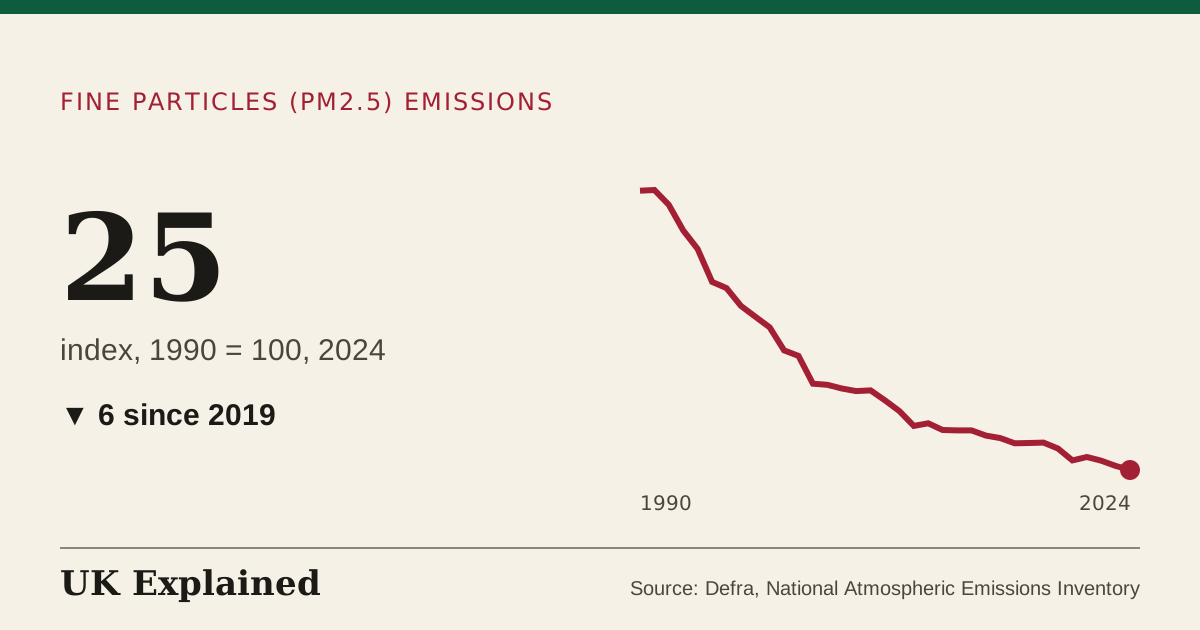
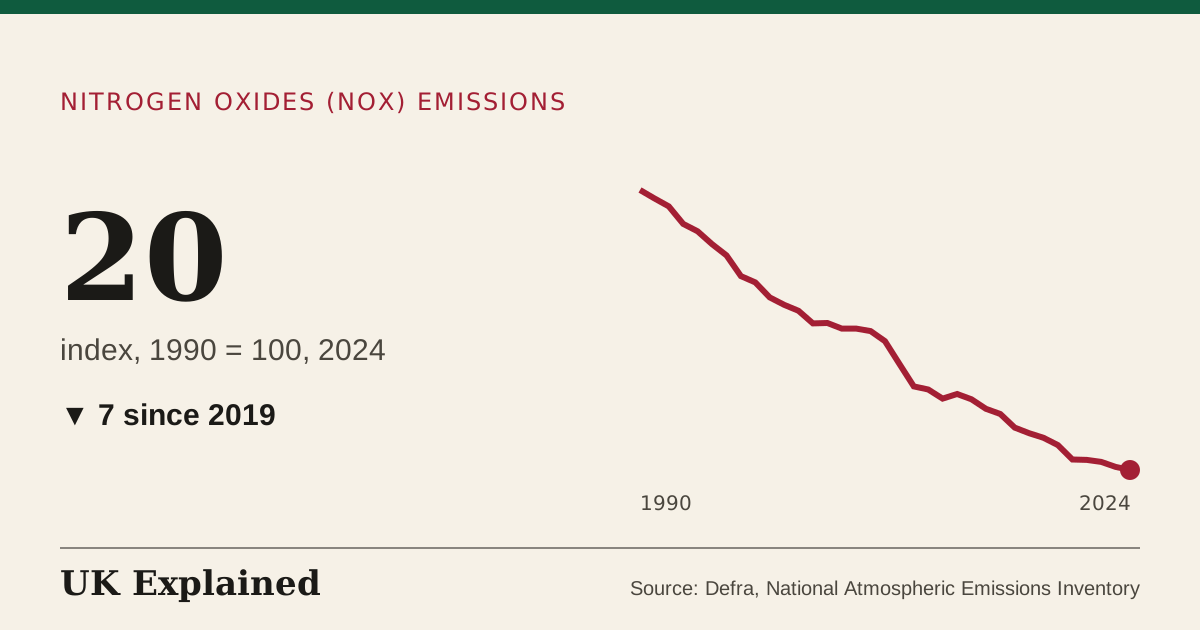
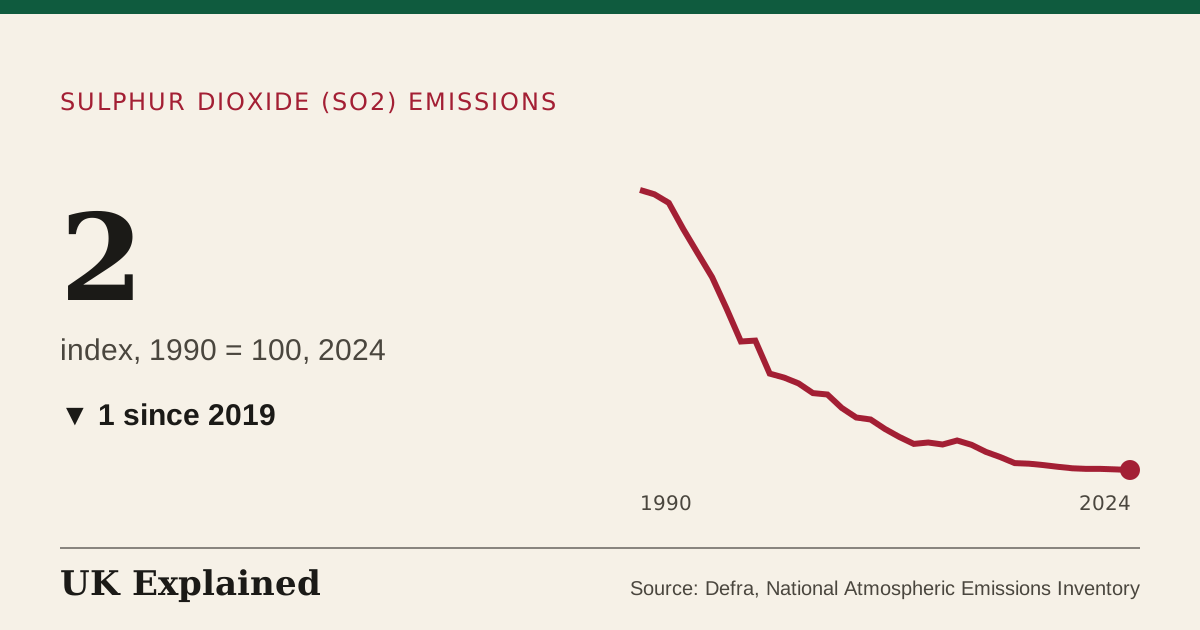
- index, 1990 = 100 · 1990 to 2024 · Source: Defra, National Atmospheric Emissions Inventory · Updated 7 November 2026
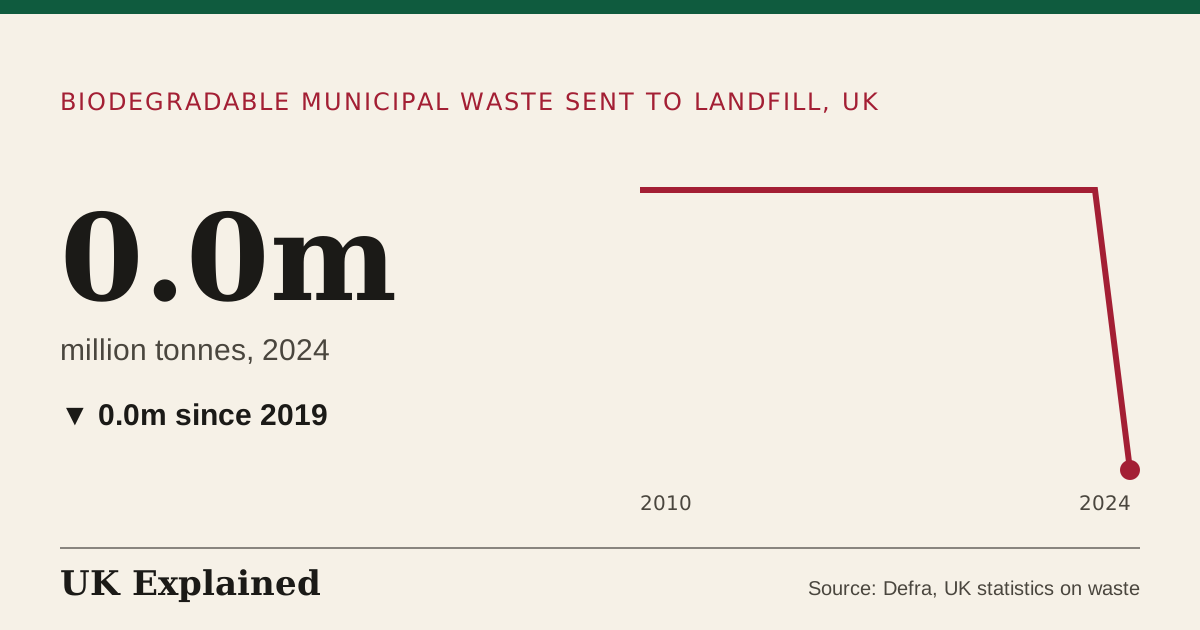
- million tonnes · 2010 to 2024 · Source: Defra, UK statistics on waste · Updated 7 November 2026
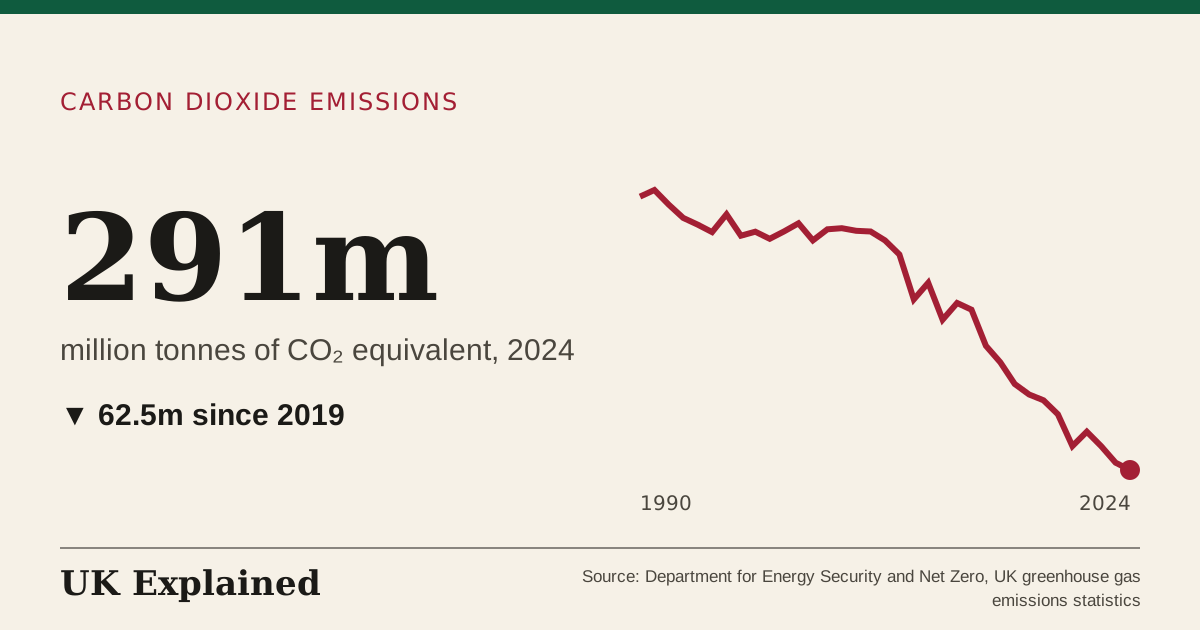
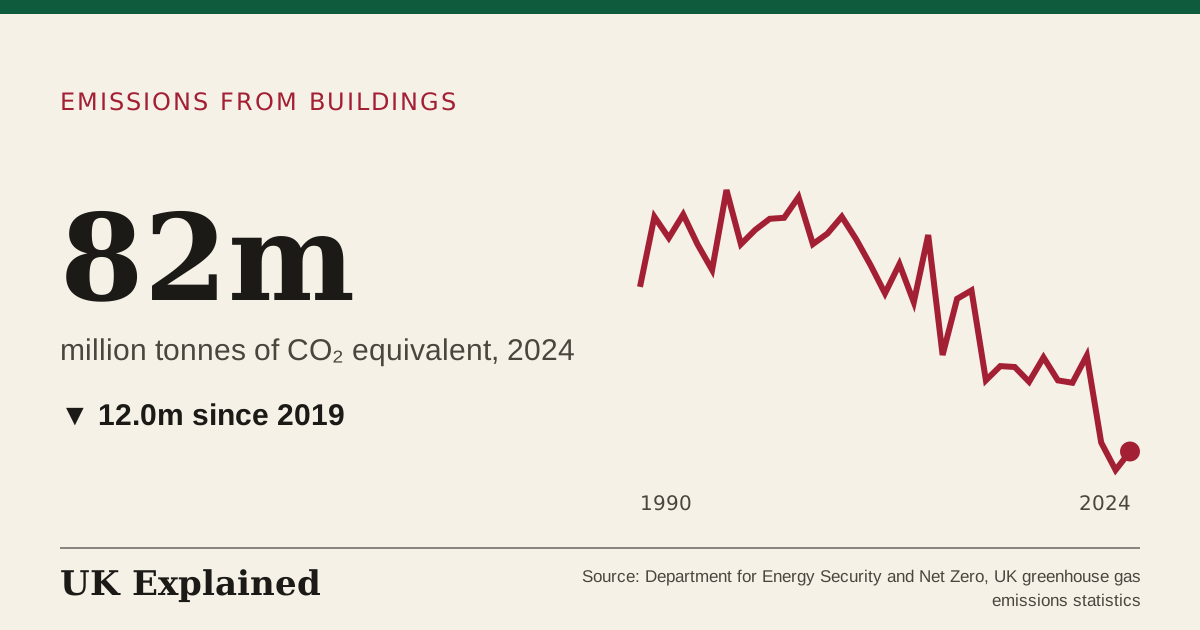
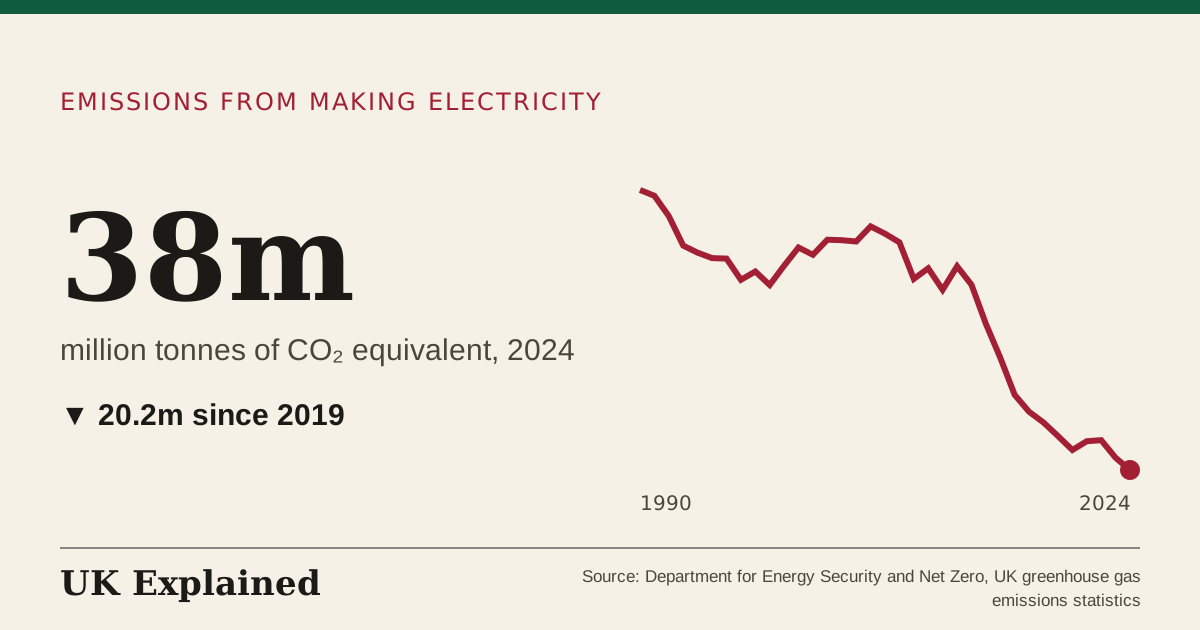
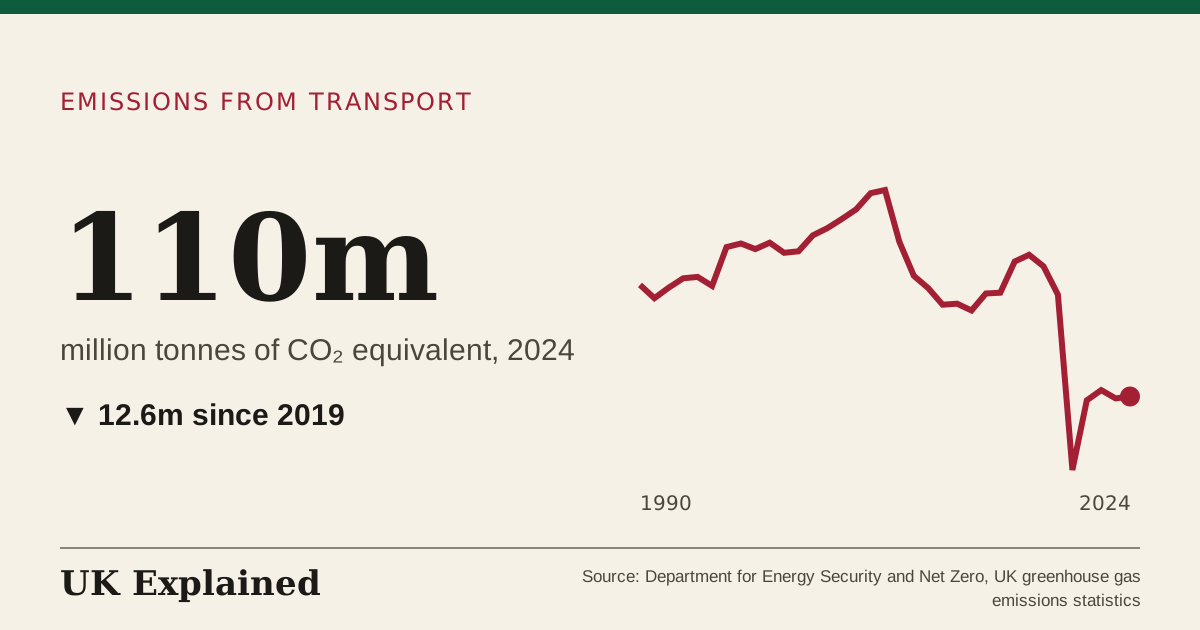
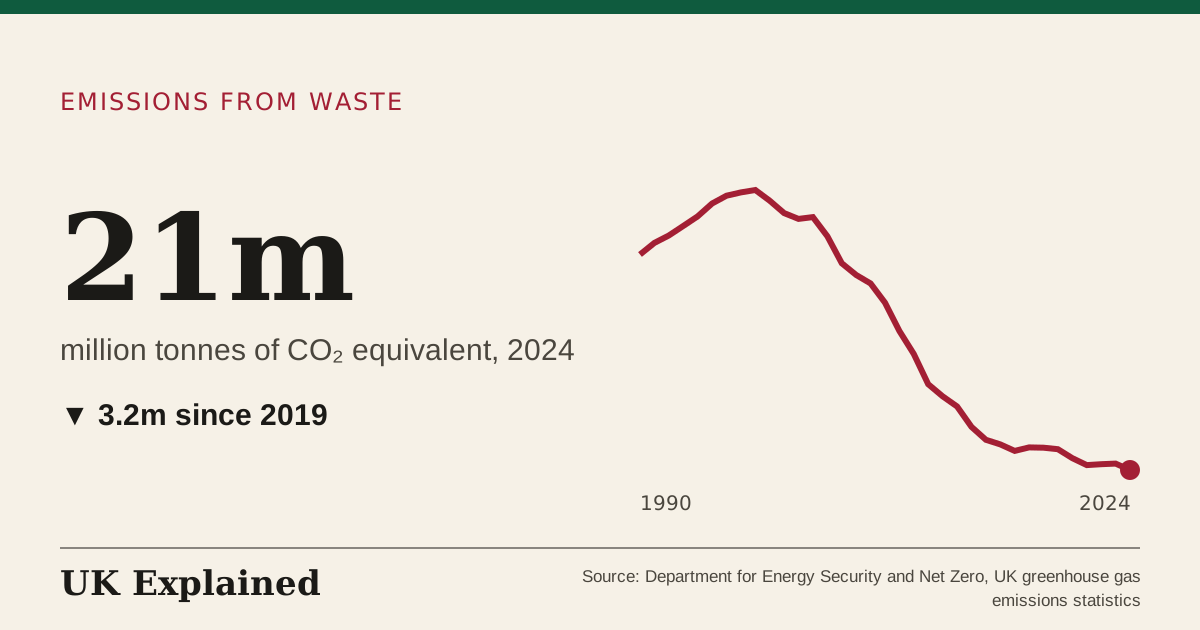
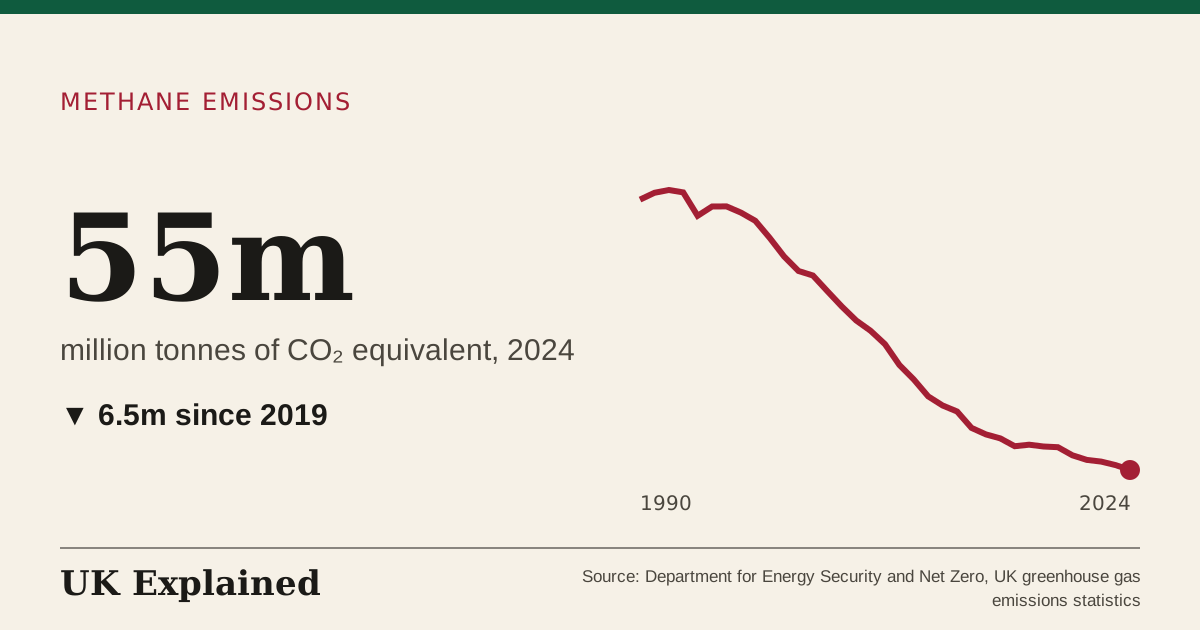
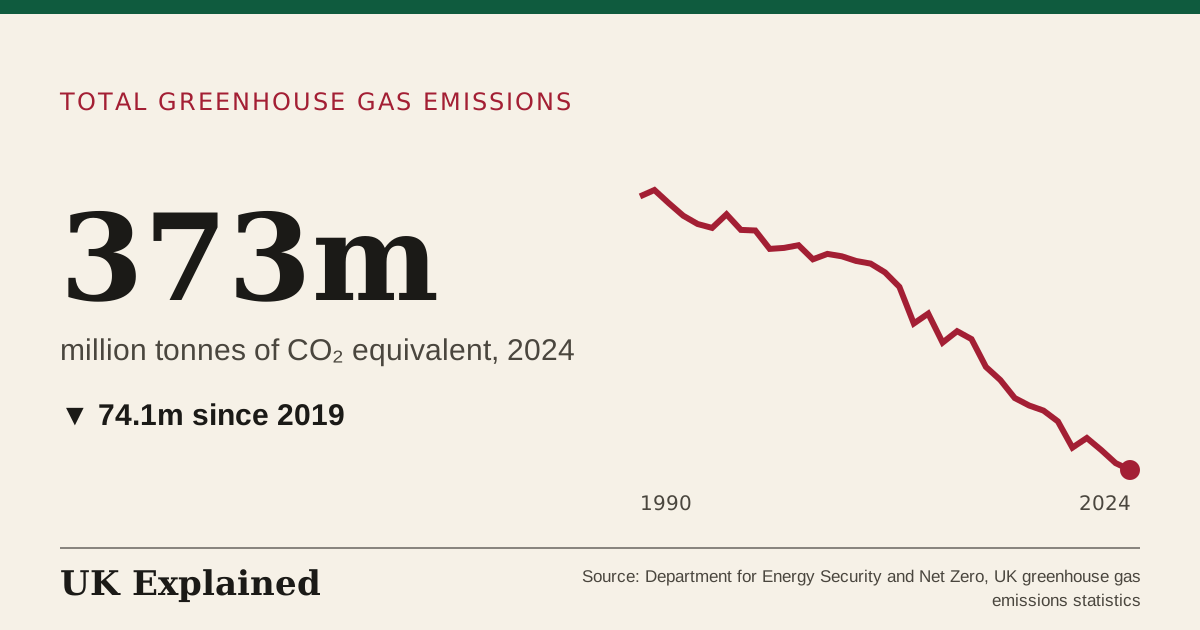
- million tonnes of CO₂ equivalent · 1990 to 2024 · Source: Department for Energy Security and Net Zero, UK greenhouse gas emissions statistics · Updated 7 November 2026
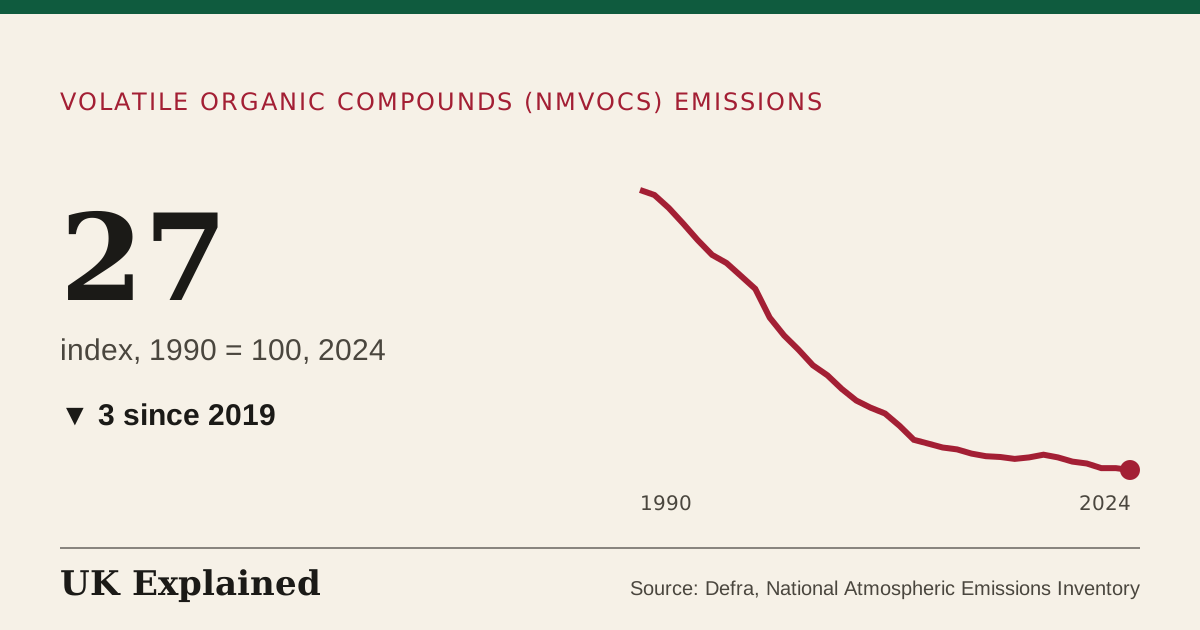
- index, 1990 = 100 · 1990 to 2024 · Source: Defra, National Atmospheric Emissions Inventory · Updated 7 November 2026
- million tonnes of CO₂ equivalent · 1990 to 2024 · Source: Department for Energy Security and Net Zero, UK greenhouse gas emissions statistics · Updated 7 November 2026
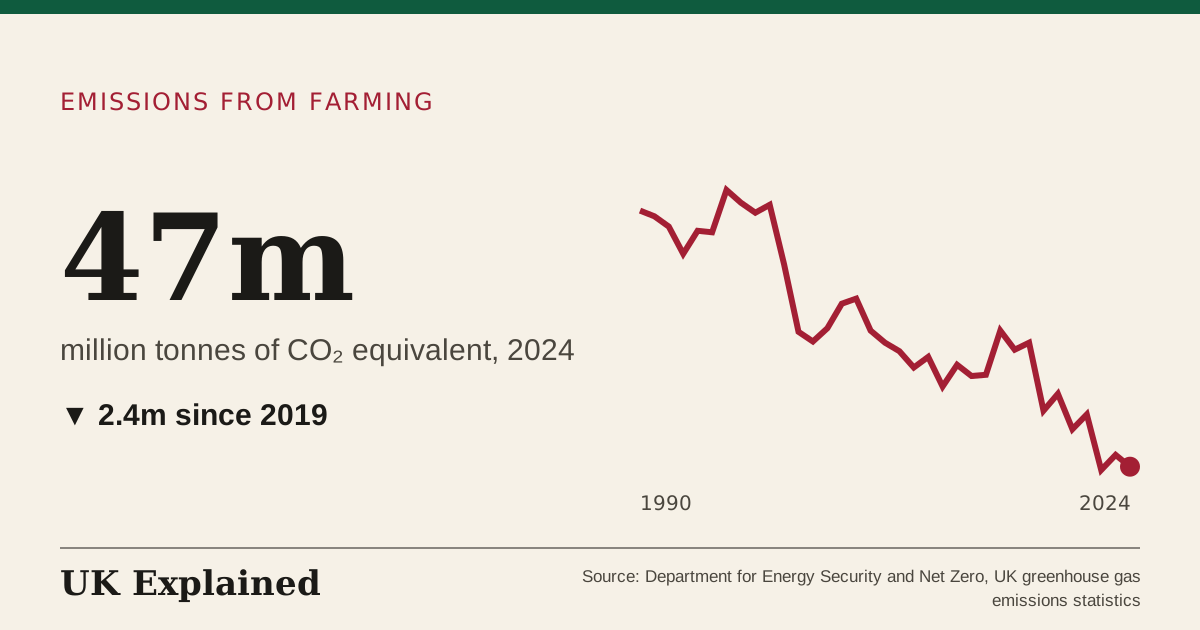
- million tonnes of CO₂ equivalent · 1990 to 2024 · Source: Department for Energy Security and Net Zero, UK greenhouse gas emissions statistics · Updated 7 November 2026
- million tonnes of CO₂ equivalent · 1990 to 2024 · Source: Department for Energy Security and Net Zero, UK greenhouse gas emissions statistics · Updated 7 November 2026
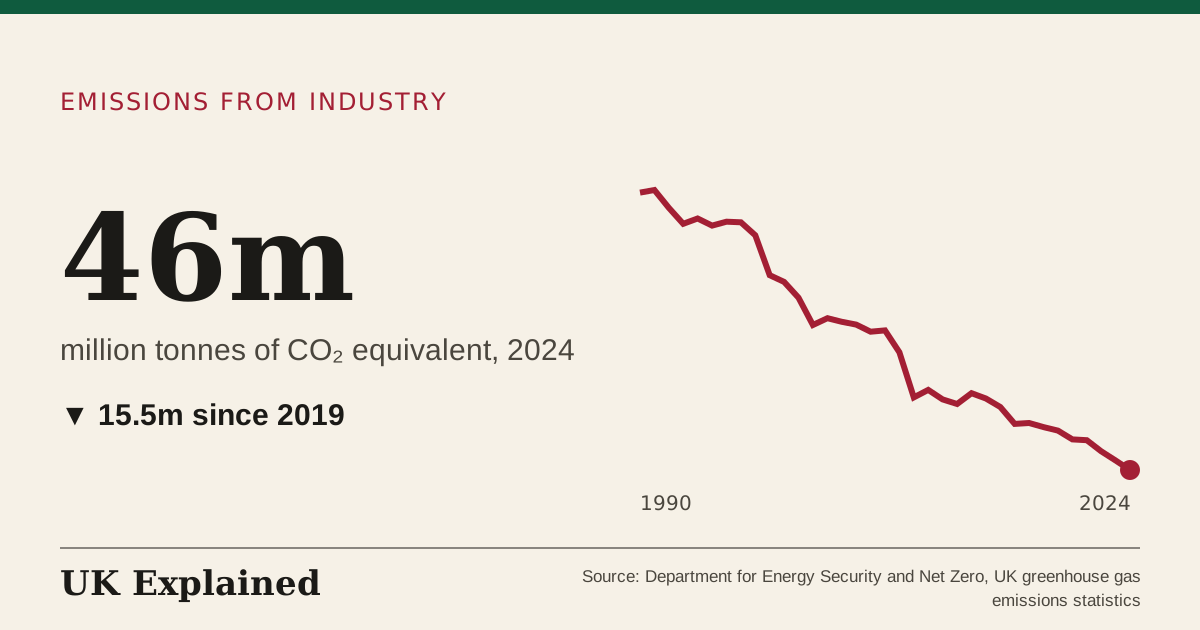
- million tonnes of CO₂ equivalent · 1990 to 2024 · Source: Department for Energy Security and Net Zero, UK greenhouse gas emissions statistics · Updated 7 November 2026
- million tonnes of CO₂ equivalent · 1990 to 2024 · Source: Department for Energy Security and Net Zero, UK greenhouse gas emissions statistics · Updated 7 November 2026
- million tonnes of CO₂ equivalent · 1990 to 2024 · Source: Department for Energy Security and Net Zero, UK greenhouse gas emissions statistics · Updated 7 November 2026
- index, 1990 = 100 · 1990 to 2024 · Source: Defra, National Atmospheric Emissions Inventory · Updated 7 November 2026
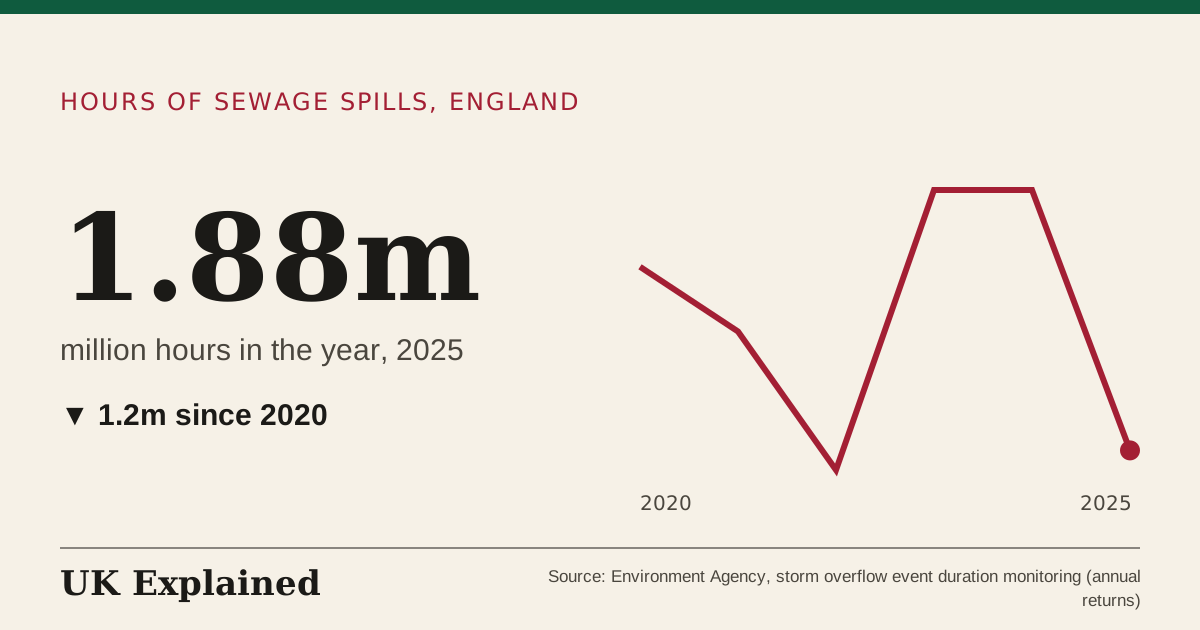
- million hours in the year · 2020 to 2025 · Source: Environment Agency, storm overflow event duration monitoring (annual returns) · Updated 7 November 2026
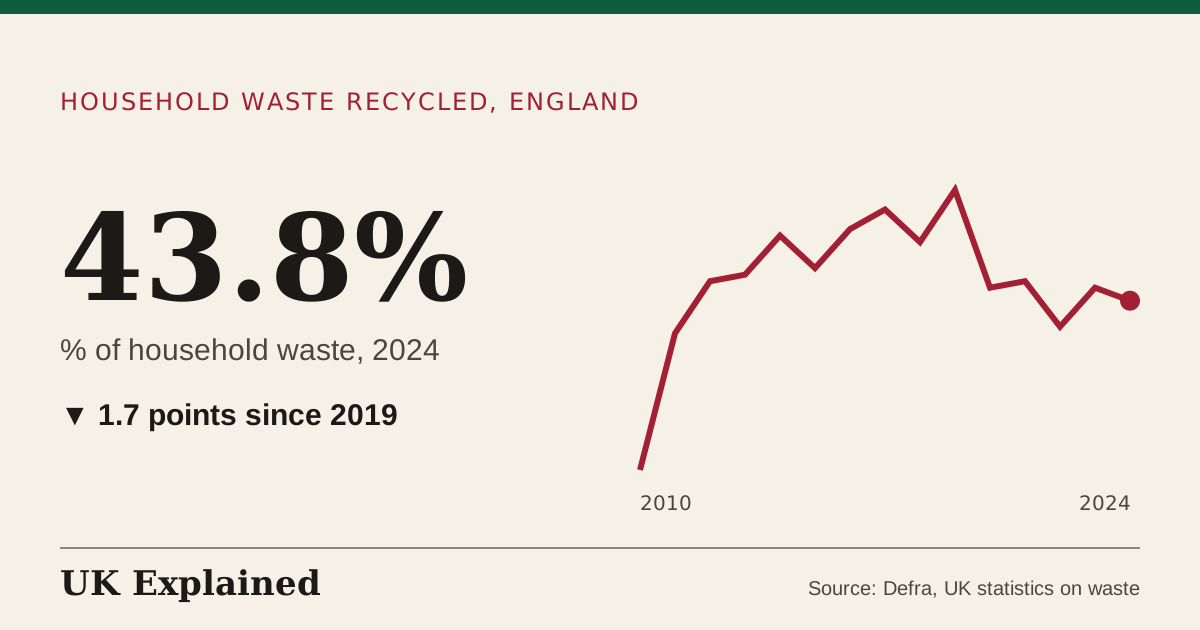
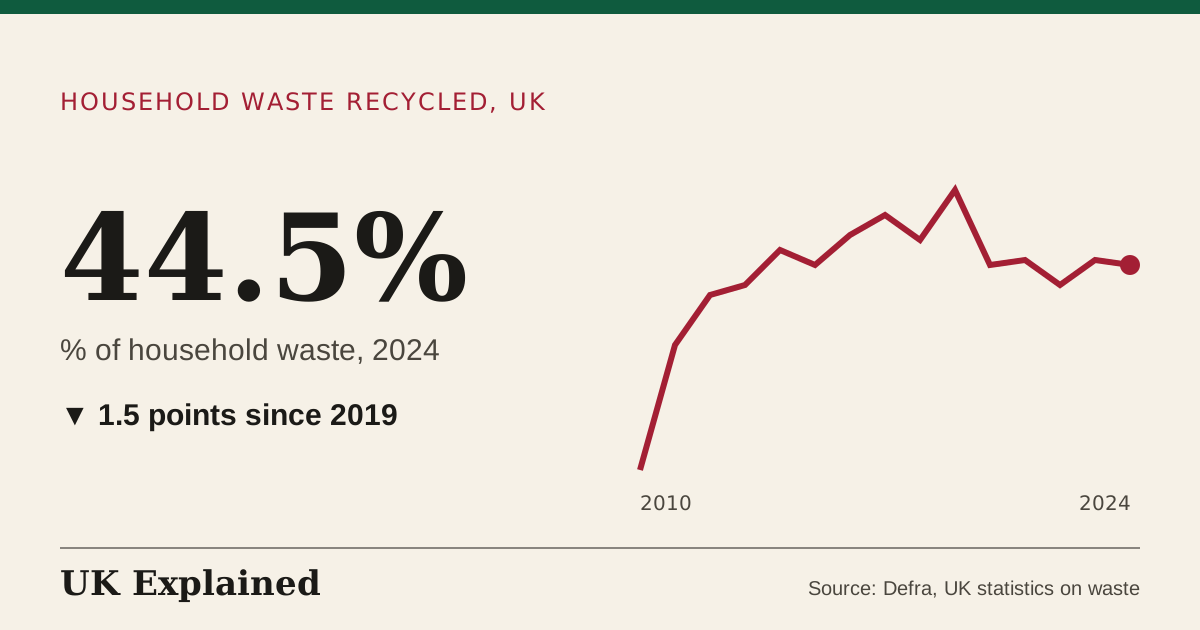
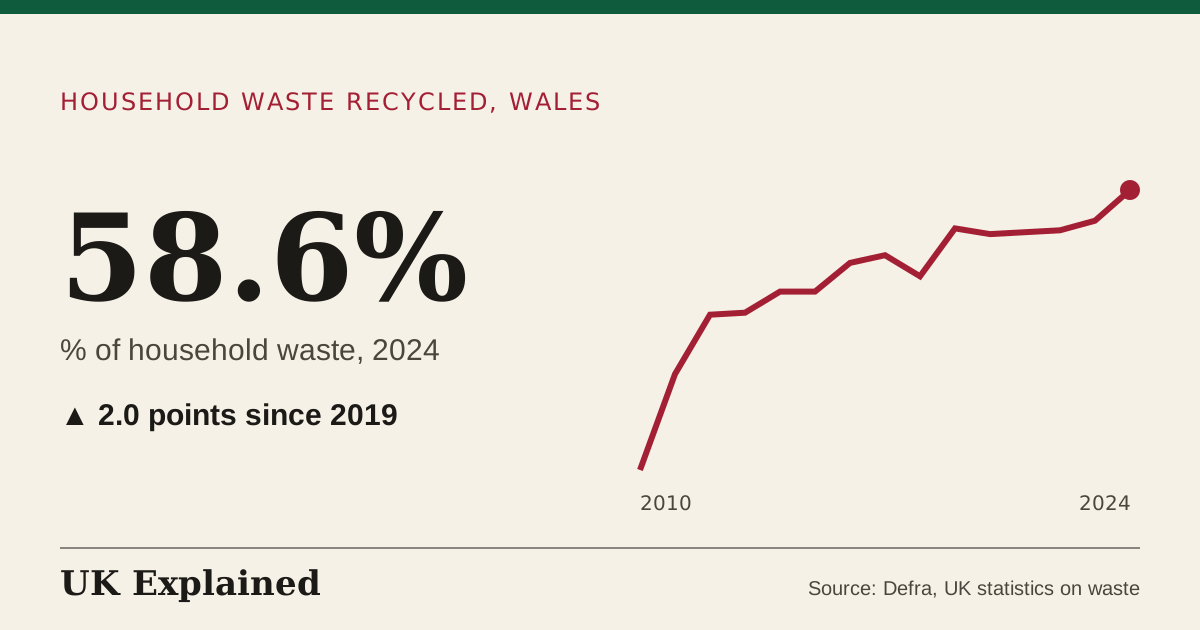
- % of household waste · 2010 to 2024 · Source: Defra, UK statistics on waste · Updated 7 November 2026
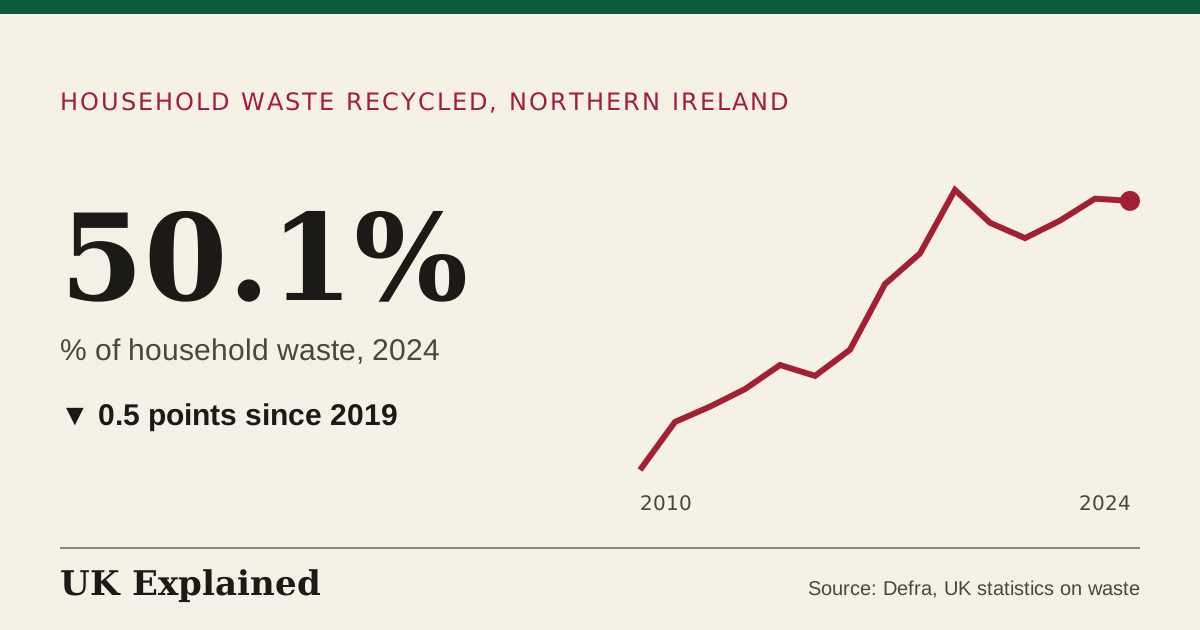
- % of household waste · 2010 to 2024 · Source: Defra, UK statistics on waste · Updated 7 November 2026
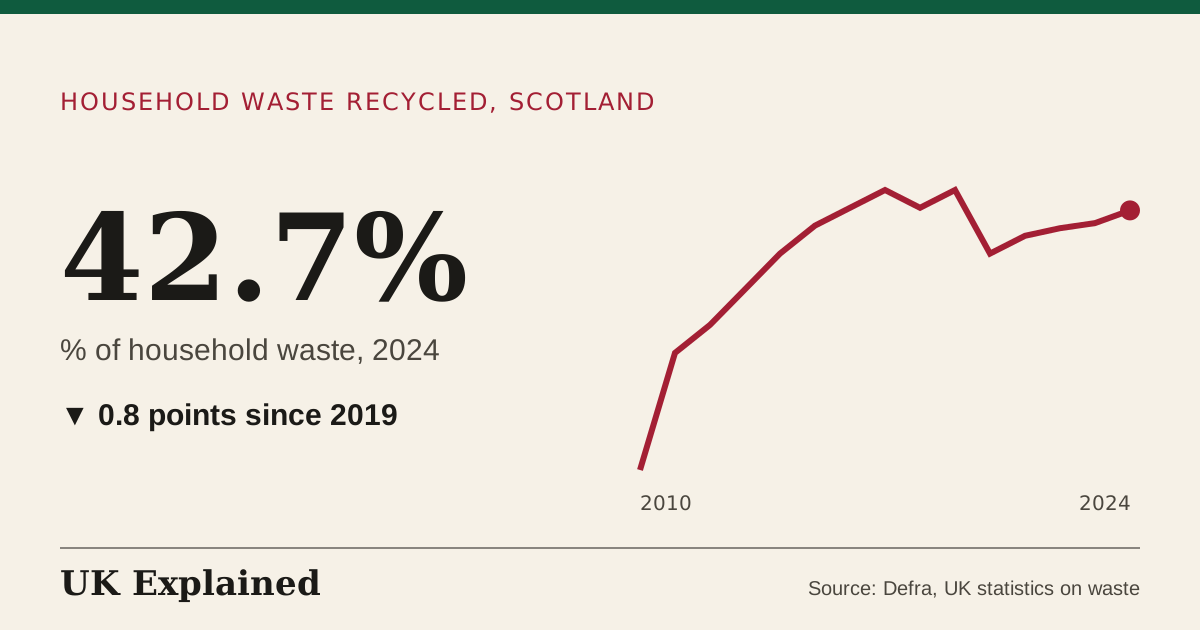
- % of household waste · 2010 to 2024 · Source: Defra, UK statistics on waste · Updated 7 November 2026
- % of household waste · 2010 to 2024 · Source: Defra, UK statistics on waste · Updated 7 November 2026
- % of household waste · 2010 to 2024 · Source: Defra, UK statistics on waste · Updated 7 November 2026
- million tonnes of CO₂ equivalent · 1990 to 2024 · Source: Department for Energy Security and Net Zero, UK greenhouse gas emissions statistics · Updated 7 November 2026
- index, 1990 = 100 · 1990 to 2024 · Source: Defra, National Atmospheric Emissions Inventory · Updated 7 November 2026
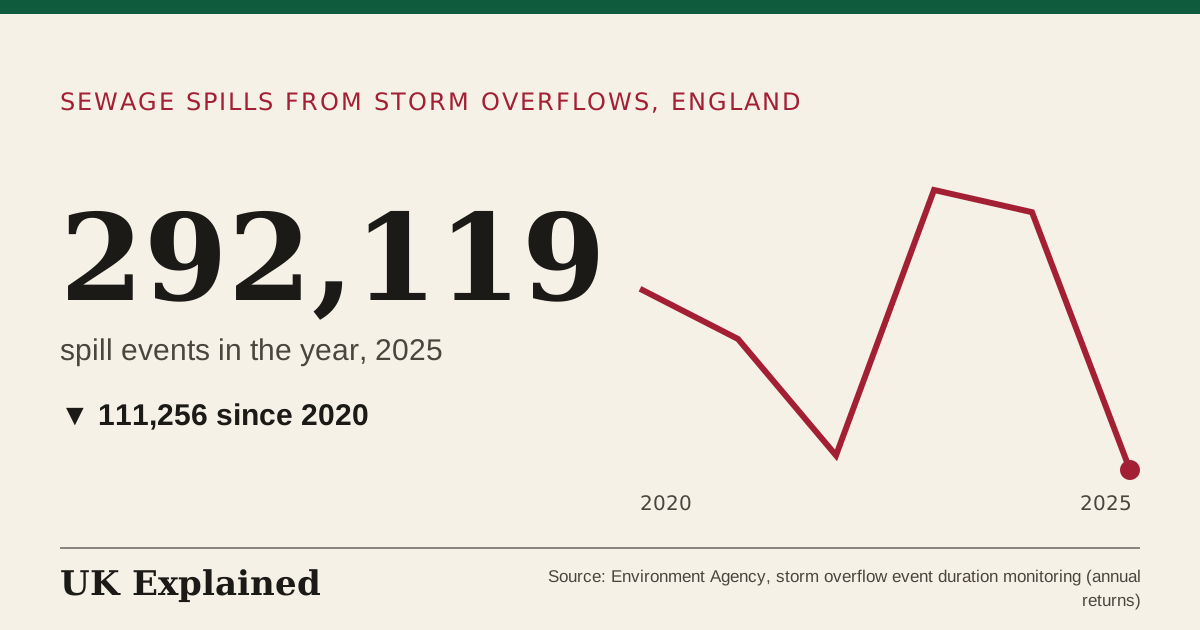
- spill events in the year · 2020 to 2025 · Source: Environment Agency, storm overflow event duration monitoring (annual returns) · Updated 7 November 2026
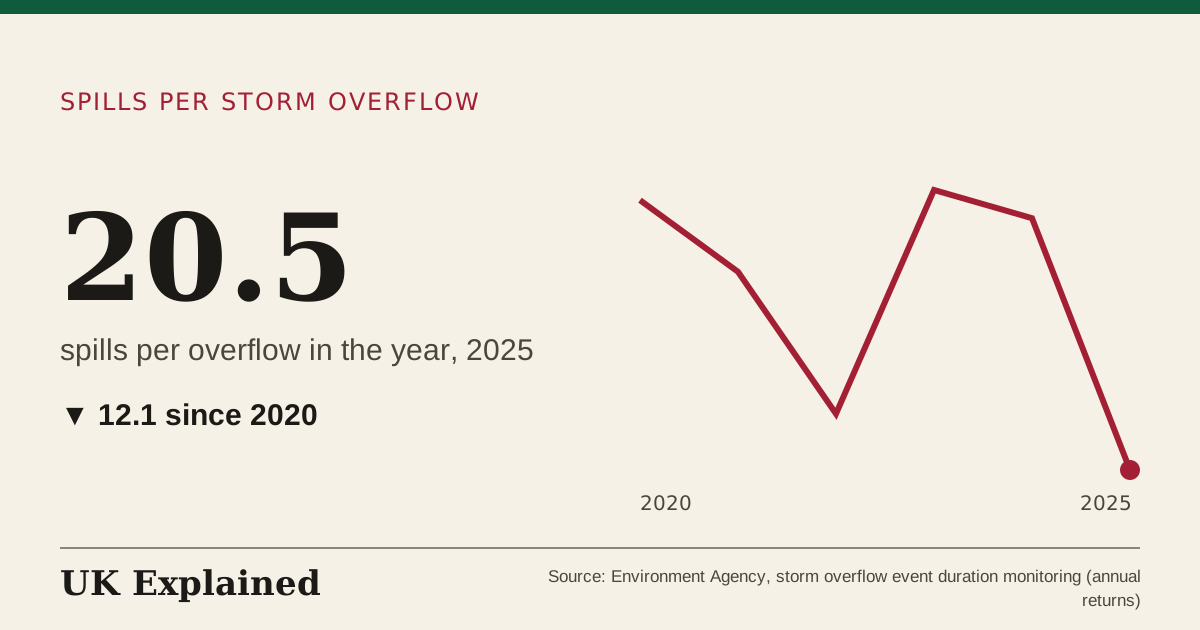
- spills per overflow in the year · 2020 to 2025 · Source: Environment Agency, storm overflow event duration monitoring (annual returns) · Updated 7 November 2026
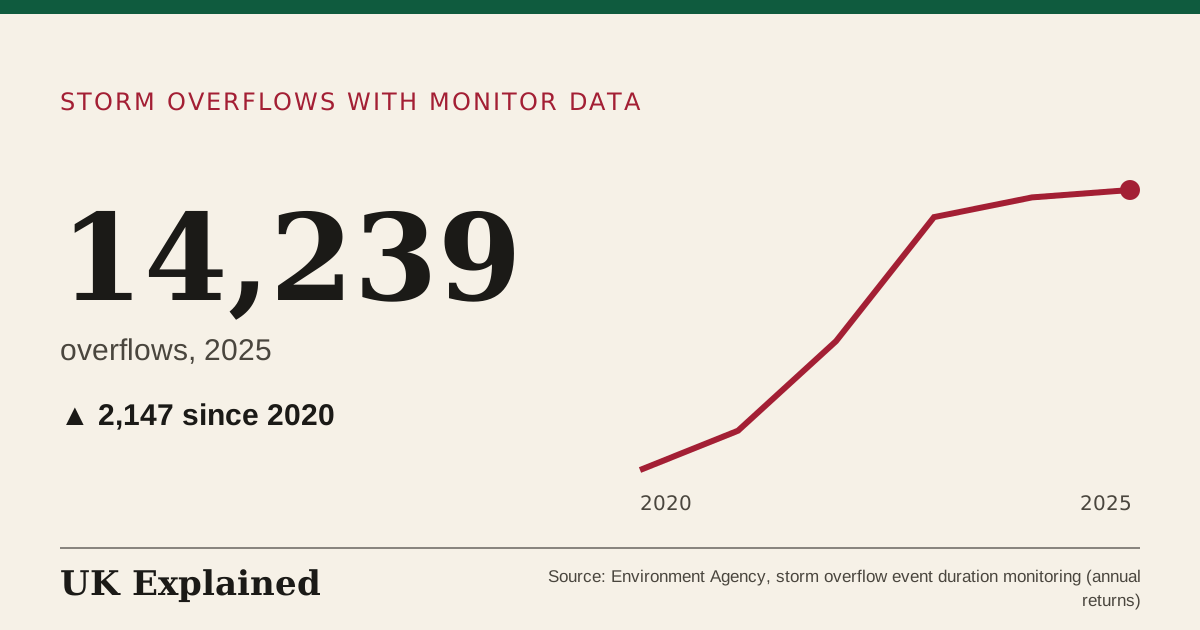
- overflows · 2020 to 2025 · Source: Environment Agency, storm overflow event duration monitoring (annual returns) · Updated 7 November 2026
- index, 1990 = 100 · 1990 to 2024 · Source: Defra, National Atmospheric Emissions Inventory · Updated 7 November 2026
- million tonnes of CO₂ equivalent · 1990 to 2024 · Source: Department for Energy Security and Net Zero, UK greenhouse gas emissions statistics · Updated 7 November 2026
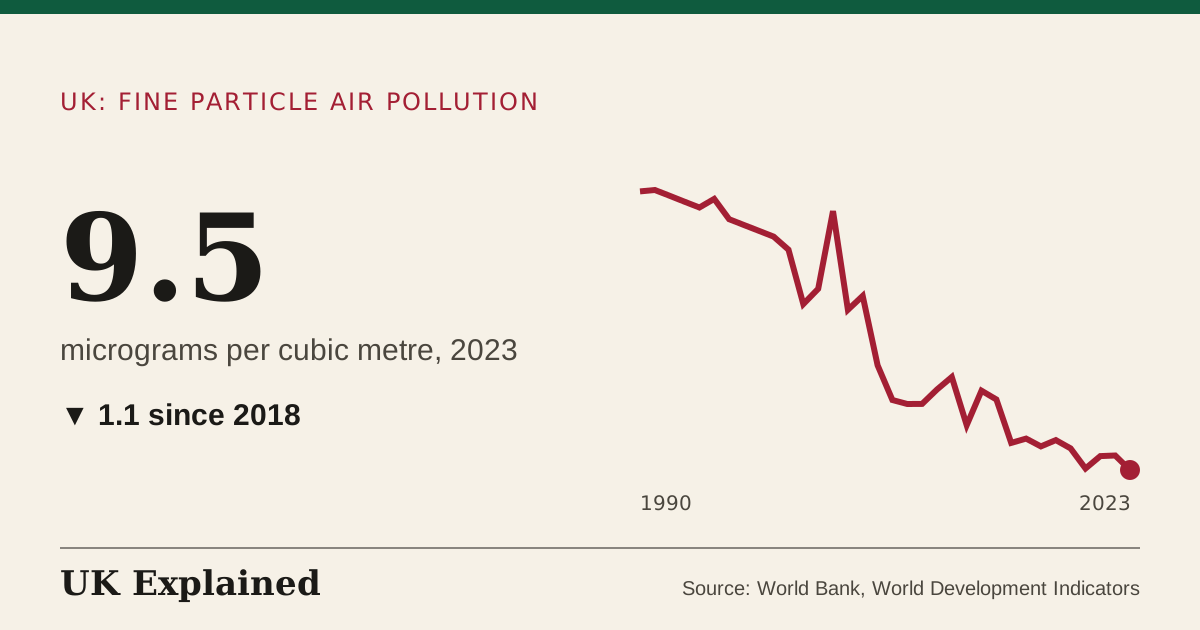
- micrograms per cubic metre · 1990 to 2023 · Source: World Bank, World Development Indicators · Updated 7 November 2026
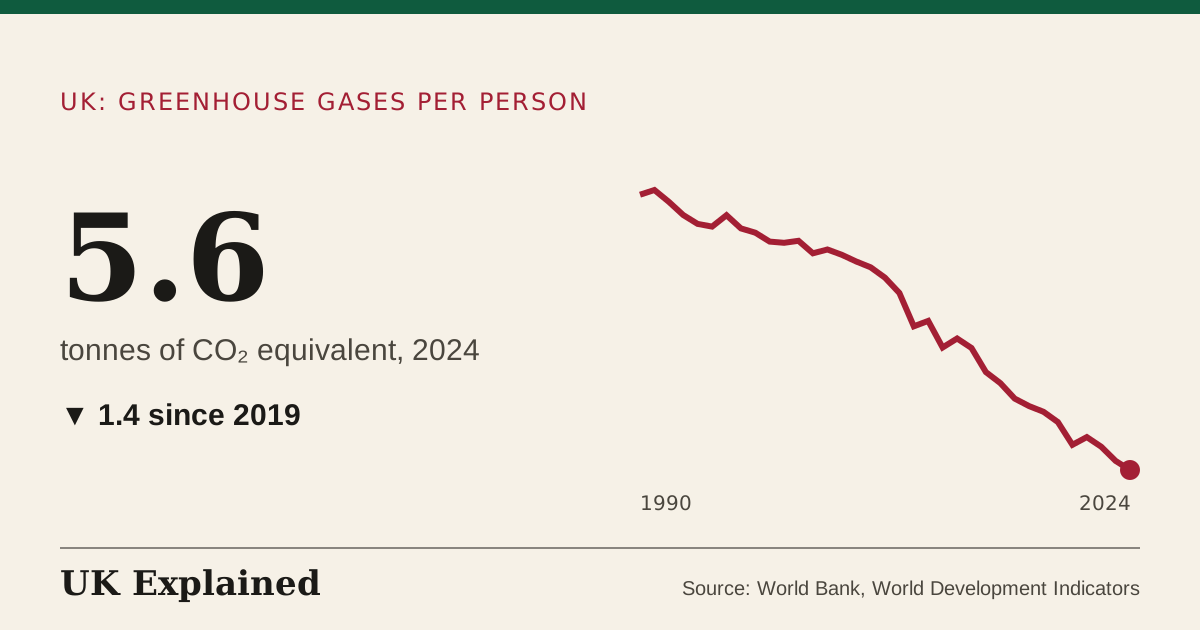
- tonnes of CO₂ equivalent · 1990 to 2024 · Source: World Bank, World Development Indicators · Updated 7 November 2026
- index, 1990 = 100 · 1990 to 2024 · Source: Defra, National Atmospheric Emissions Inventory · Updated 7 November 2026
- index, 2015 = 100 · January 1998 to September 2026 · Source: ONS Consumer Prices Index · Updated 7 November 2026
- % a year · January 1998 to September 2026 · Source: ONS Consumer Prices Index · Updated 7 November 2026
Defence and overseas aid
(6)
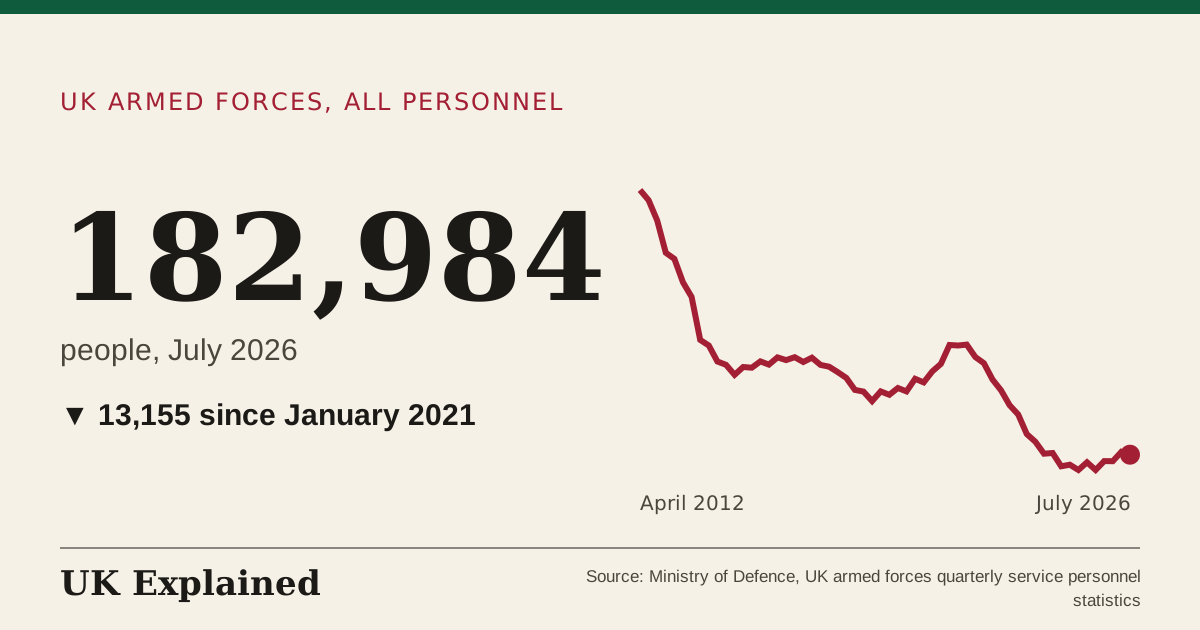
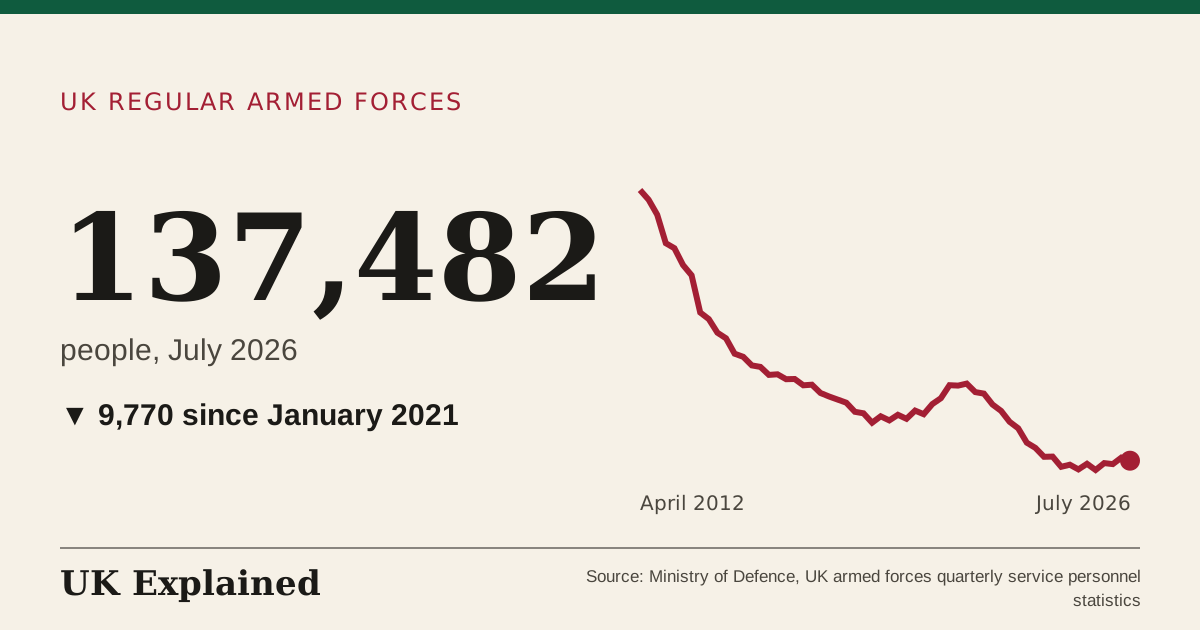
- people · April 2012 to July 2026 · Source: Ministry of Defence, UK armed forces quarterly service personnel statistics · Updated 7 November 2026
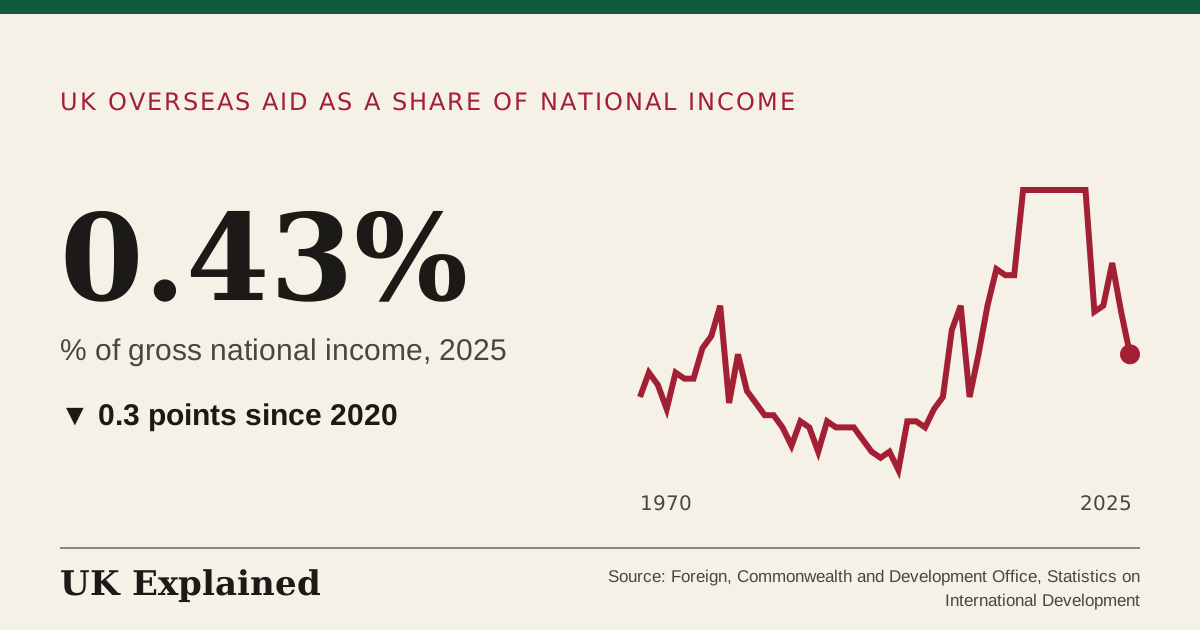
- % of gross national income · 1970 to 2025 · Source: Foreign, Commonwealth and Development Office, Statistics on International Development · Updated 7 November 2026
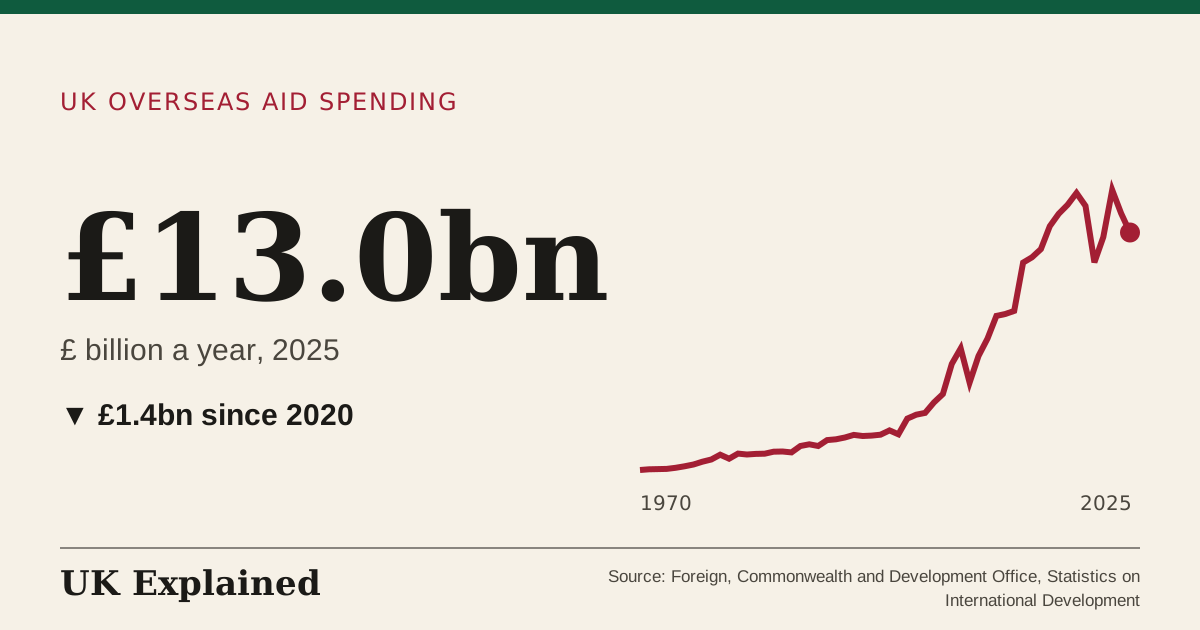
- £ billion a year · 1970 to 2025 · Source: Foreign, Commonwealth and Development Office, Statistics on International Development · Updated 7 November 2026
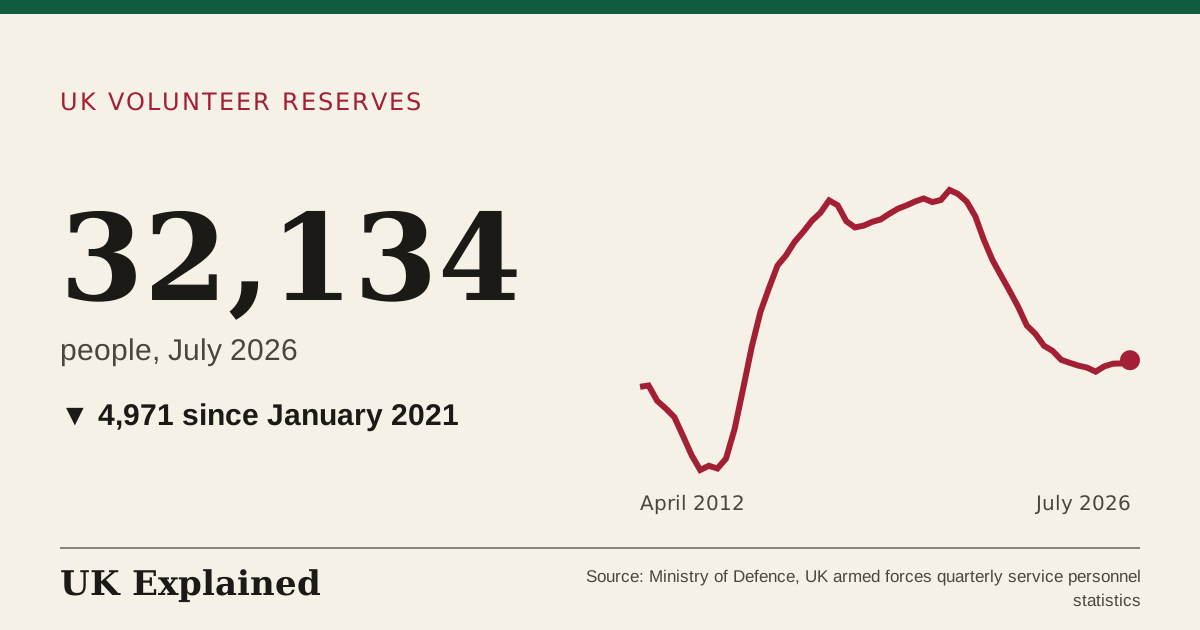
- people · April 2012 to July 2026 · Source: Ministry of Defence, UK armed forces quarterly service personnel statistics · Updated 7 November 2026
- people · April 2012 to July 2026 · Source: Ministry of Defence, UK armed forces quarterly service personnel statistics · Updated 7 November 2026
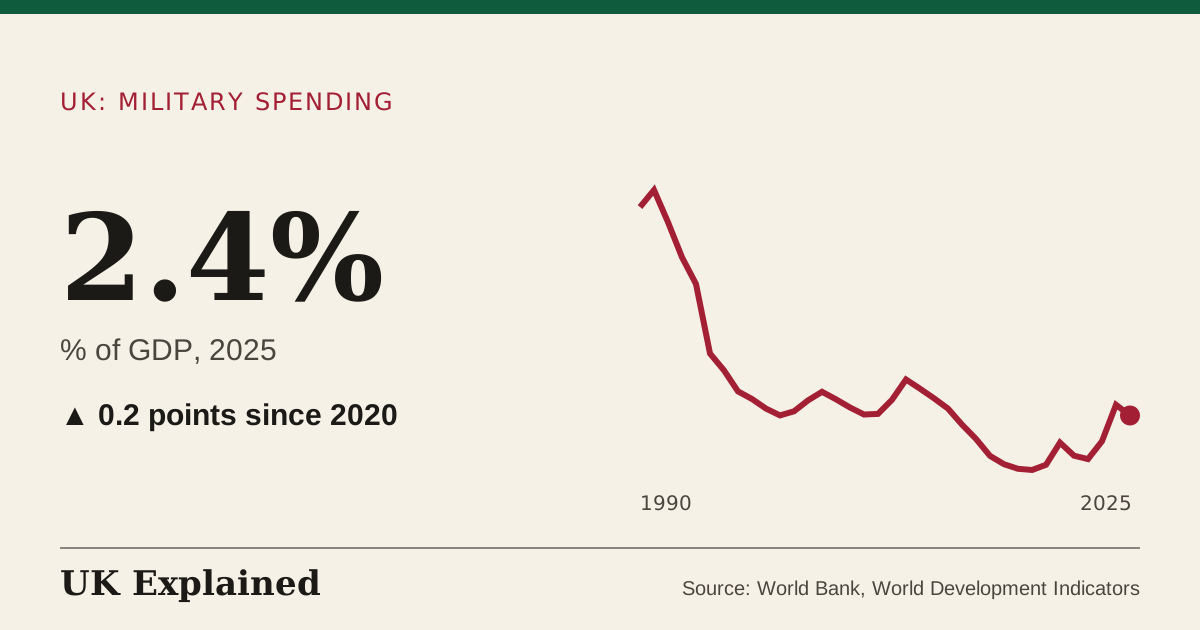
- % of GDP · 1990 to 2025 · Source: World Bank, World Development Indicators · Updated 7 November 2026
Local government
(1)
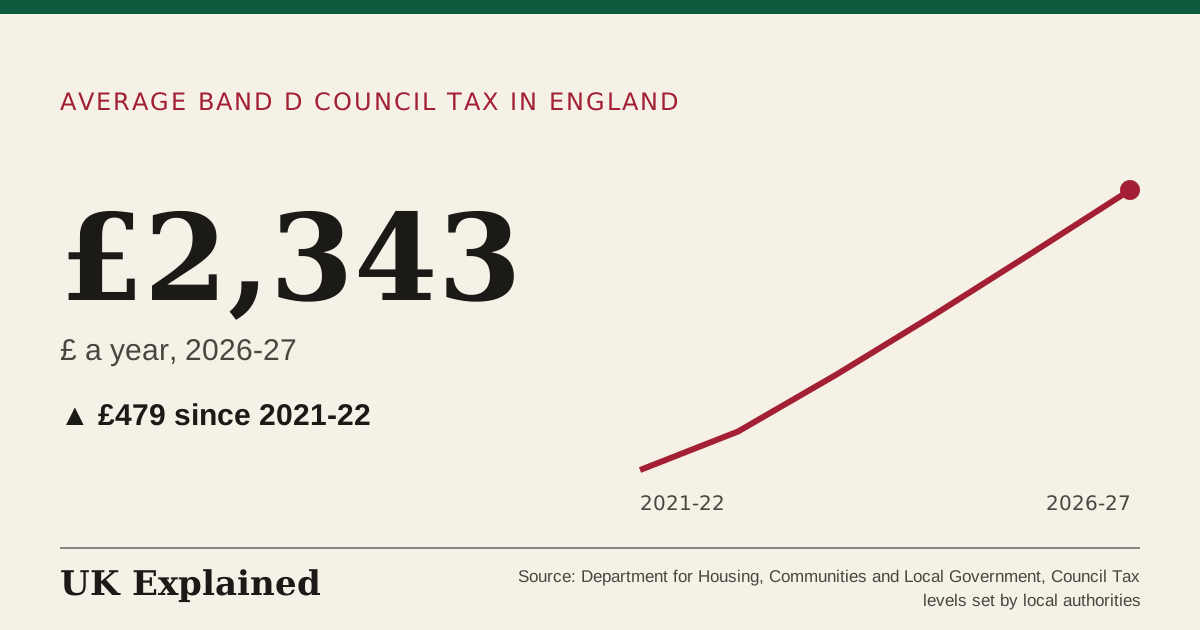
- £ a year · 2021–22 to 2026–27 · Source: Department for Housing, Communities and Local Government, Council Tax levels set by local authorities · Updated 7 November 2026
Elections, constituencies and MPs
(4)
- various (see the column names) · 650 constituencies, latest figures · Source: ONS via Nomis (pay, claimants); House of Commons Library (election); ONS Census 2021 (England and Wales only) · Updated 7 November 2026
- % of votes, and counts · 638 MPs who take part in votes · Source: UK Parliament Commons Votes API and Members API, last 12 months of votes · Updated 11 November 2026
- People registered to votemillions of registered voters · 2010 to 2024 · Source: UK Parliament, election results · Updated 7 November 2026
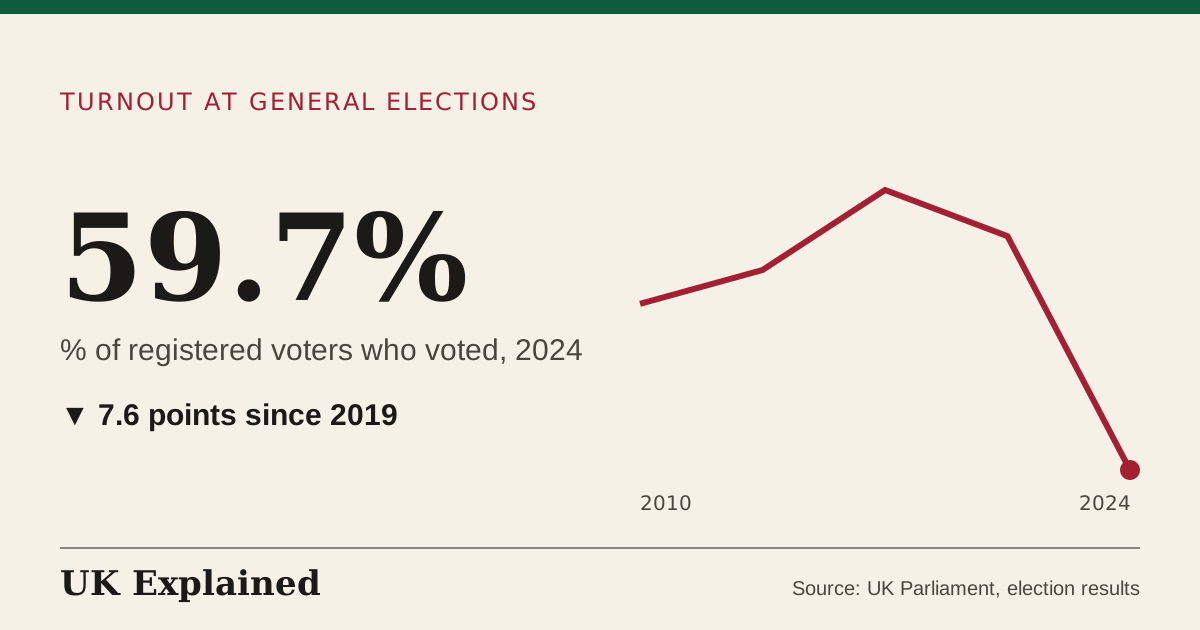
- Turnout at general elections% of registered voters who voted · 2010 to 2024 · Source: UK Parliament, election results · Updated 7 November 2026

The UK against other countries
(30)
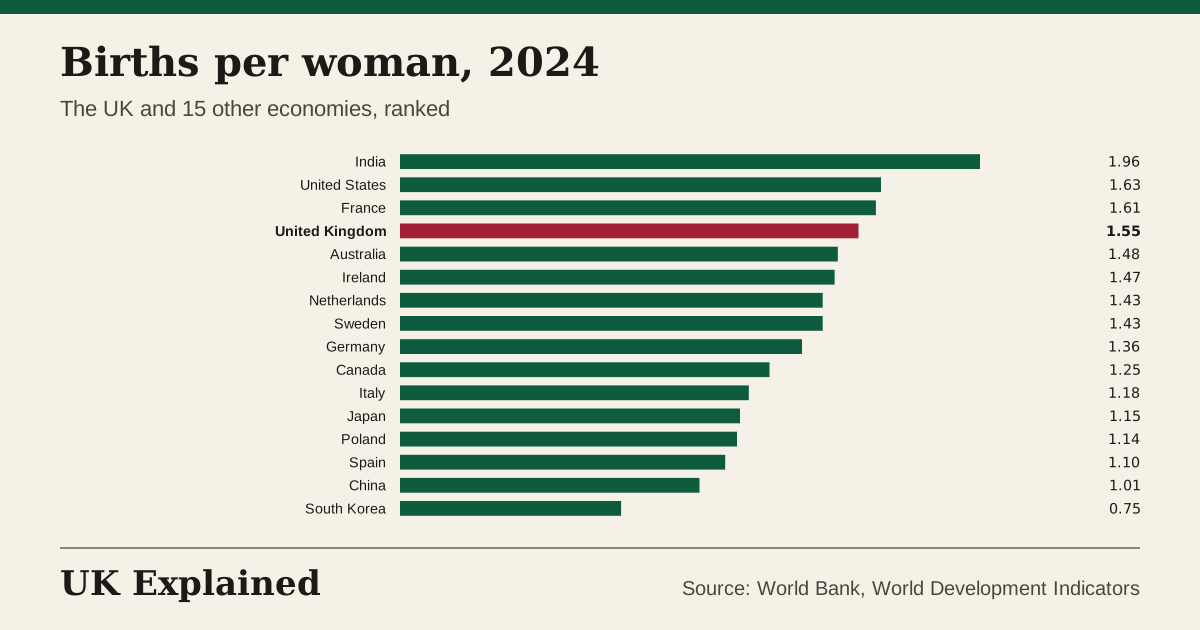
- children per woman · 2024 · Source: World Bank, World Development Indicators · Updated 7 November 2026
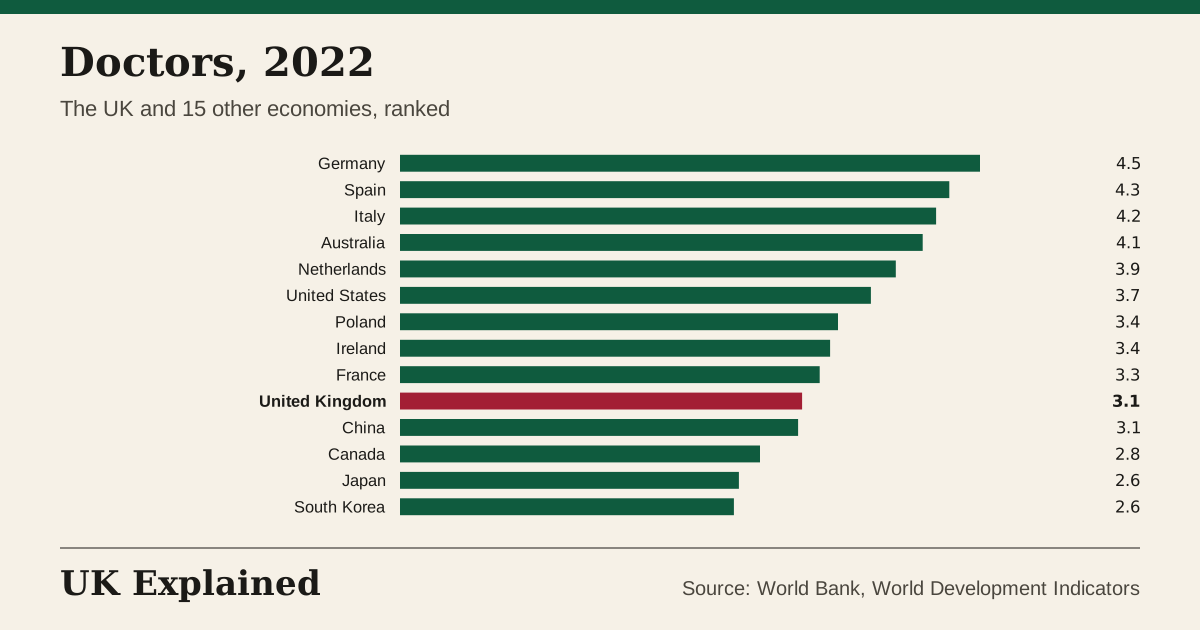
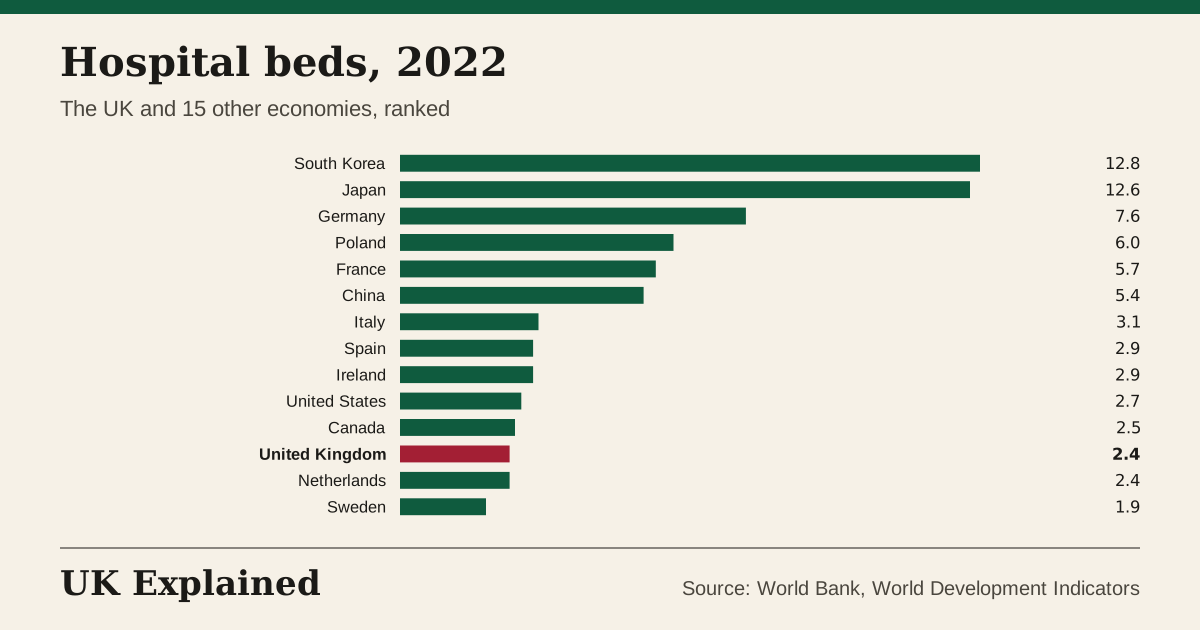
- per 1,000 people · 2022 · Source: World Bank, World Development Indicators · Updated 7 November 2026
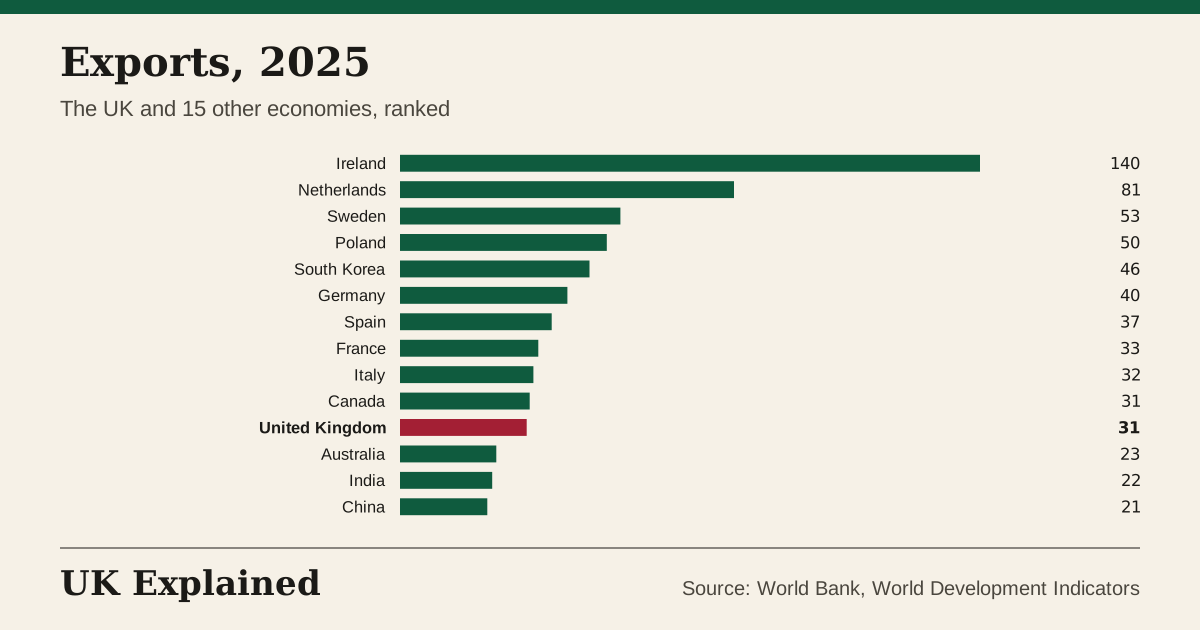
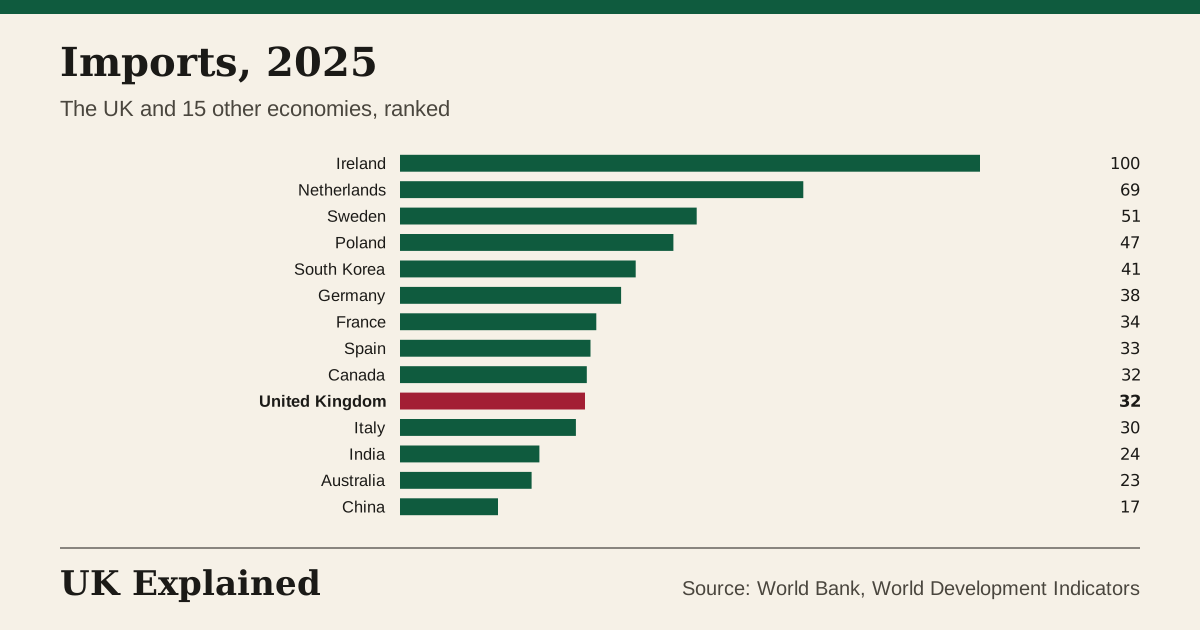
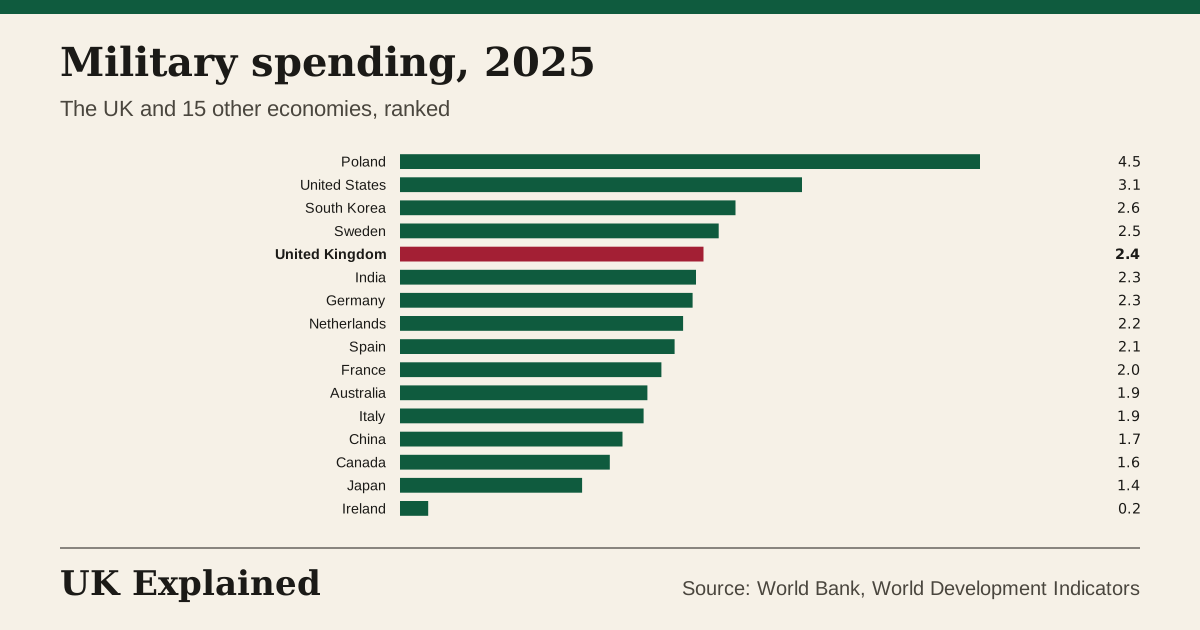
- % of GDP · 2025 · Source: World Bank, World Development Indicators · Updated 7 November 2026
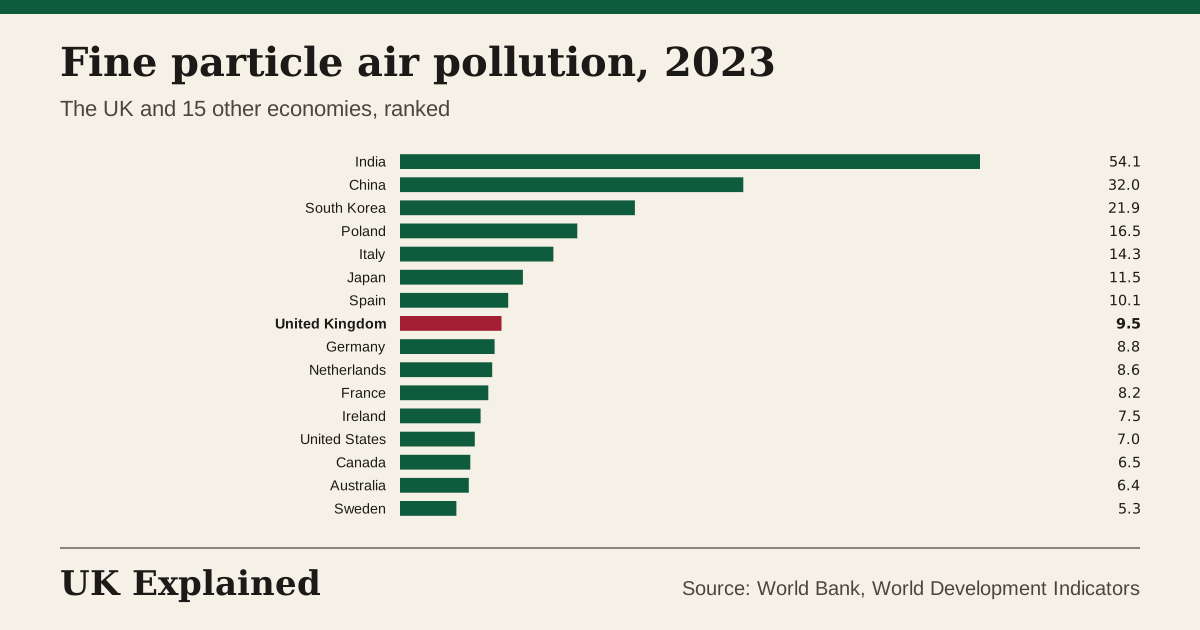
- micrograms per cubic metre · 2023 · Source: World Bank, World Development Indicators · Updated 7 November 2026
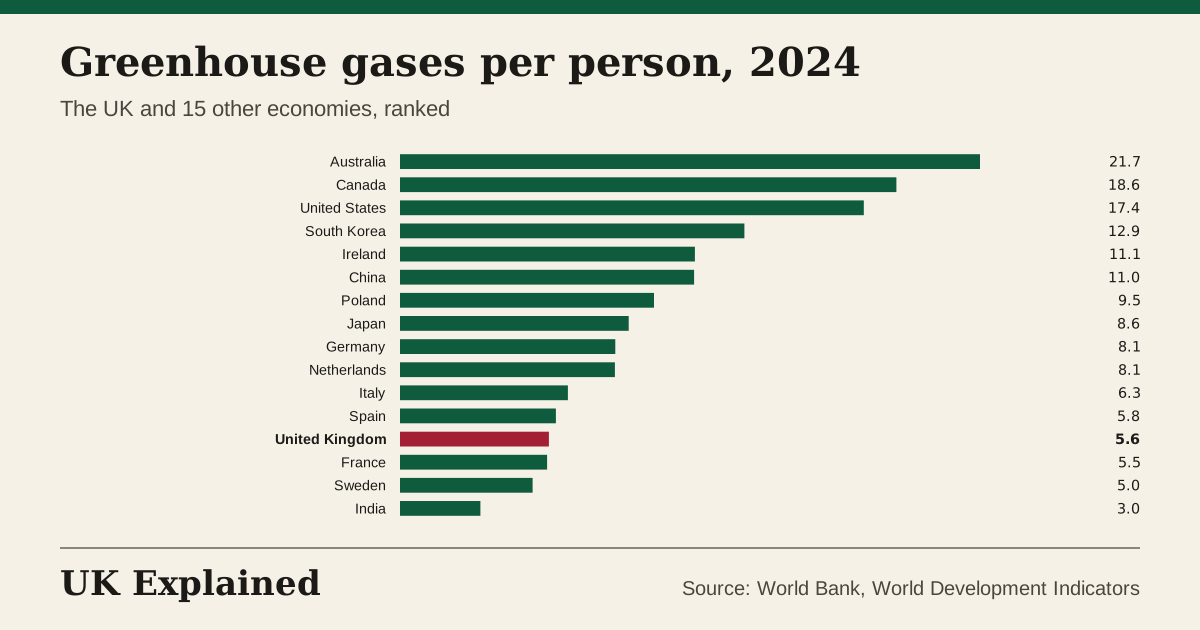
- tonnes of CO₂ equivalent · 2024 · Source: World Bank, World Development Indicators · Updated 7 November 2026
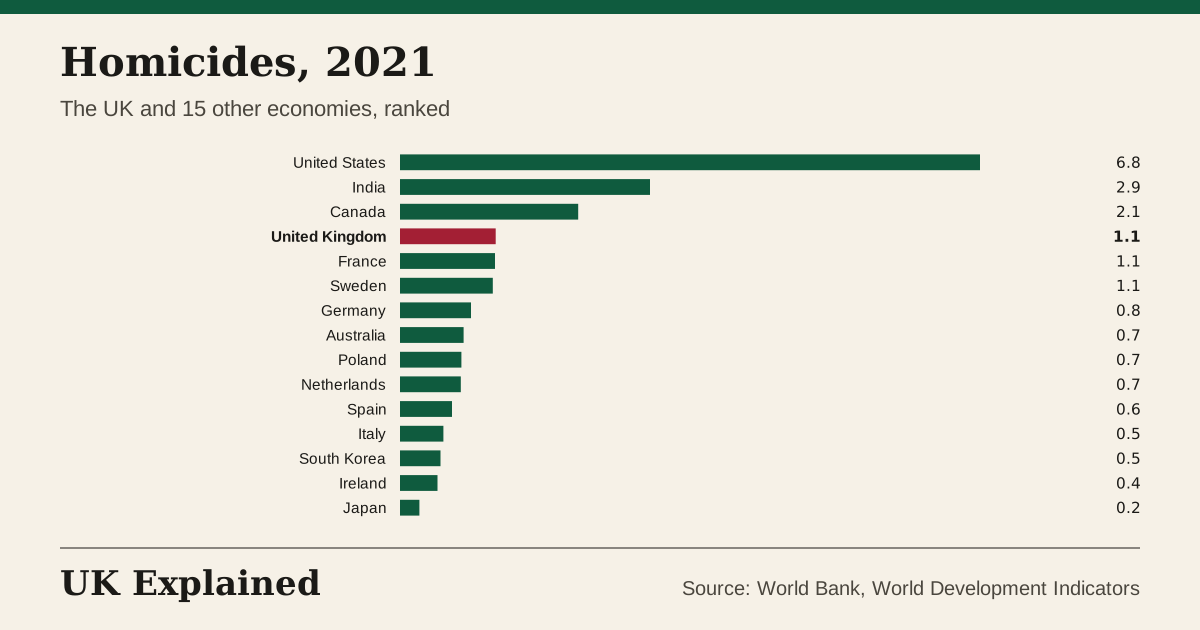
- per 100,000 people · 2021 · Source: World Bank, World Development Indicators · Updated 7 November 2026
- per 1,000 people · 2022 · Source: World Bank, World Development Indicators · Updated 7 November 2026
- % of GDP · 2025 · Source: World Bank, World Development Indicators · Updated 7 November 2026
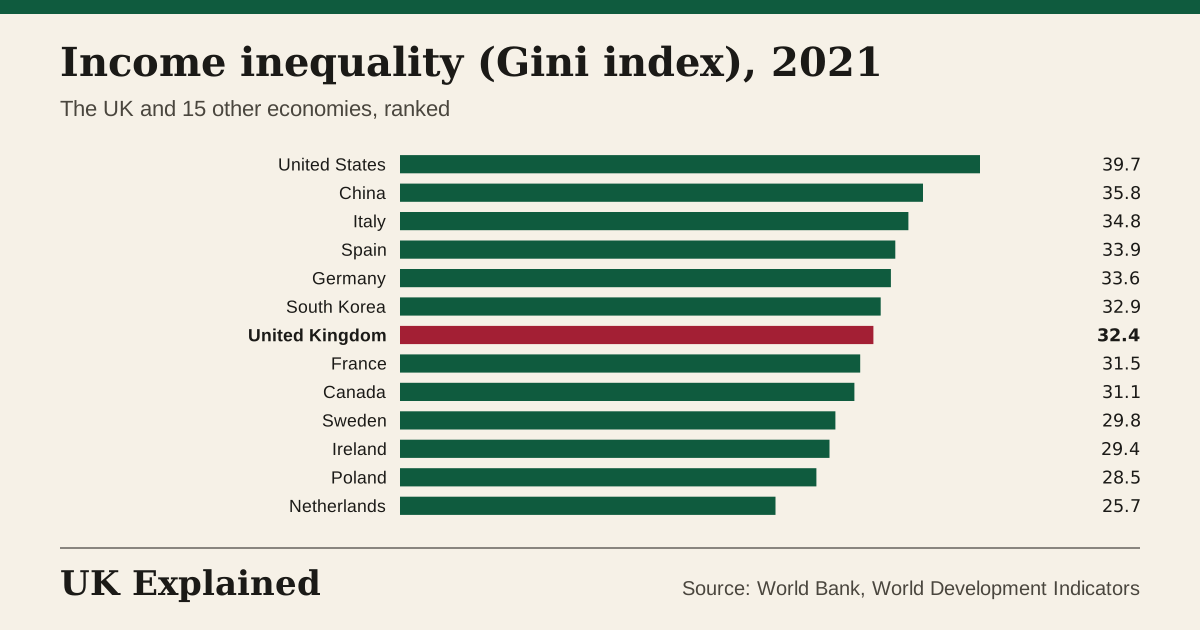
- 0 = equal, 100 = unequal · 2021 · Source: World Bank, World Development Indicators · Updated 7 November 2026
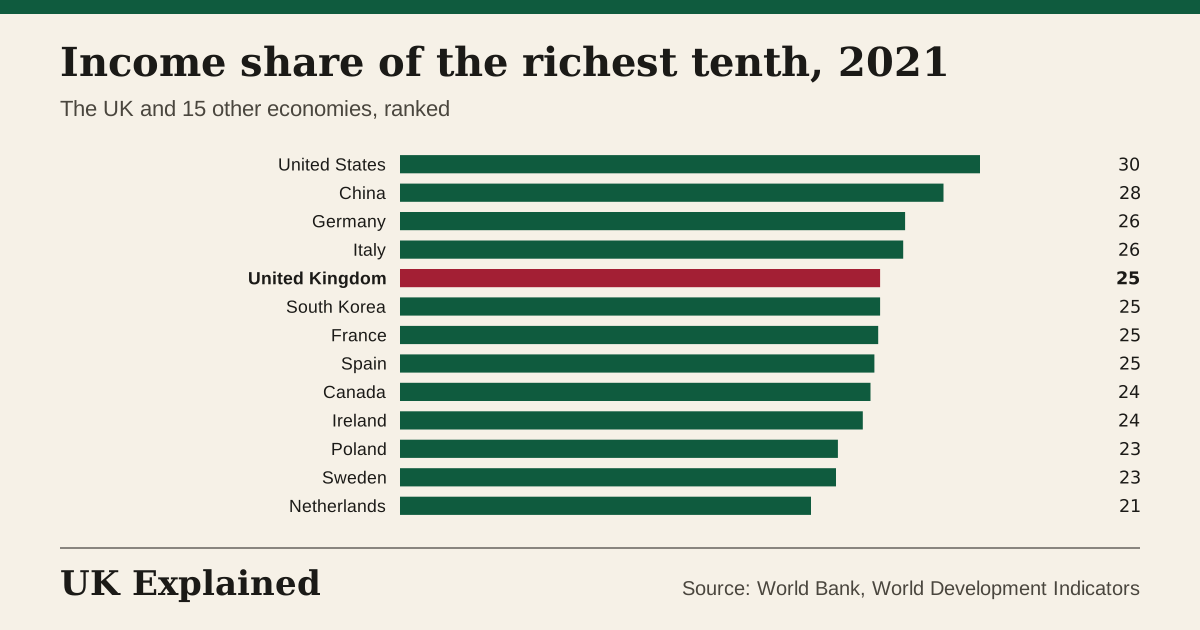
- % of income · 2021 · Source: World Bank, World Development Indicators · Updated 7 November 2026
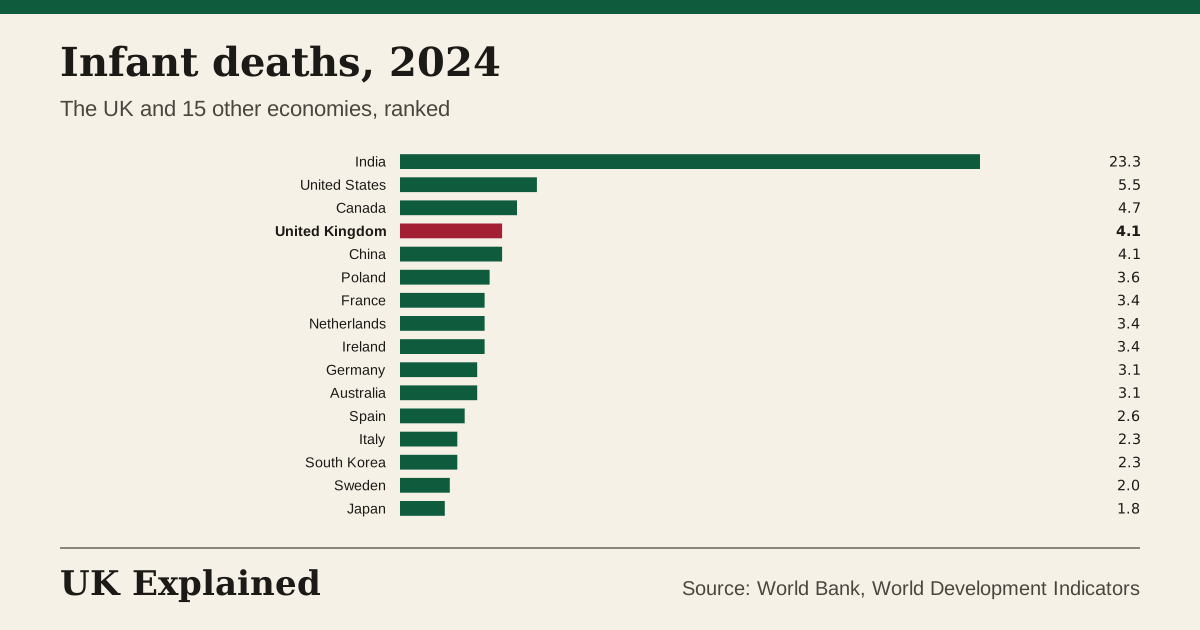
- deaths per 1,000 births · 2024 · Source: World Bank, World Development Indicators · Updated 7 November 2026
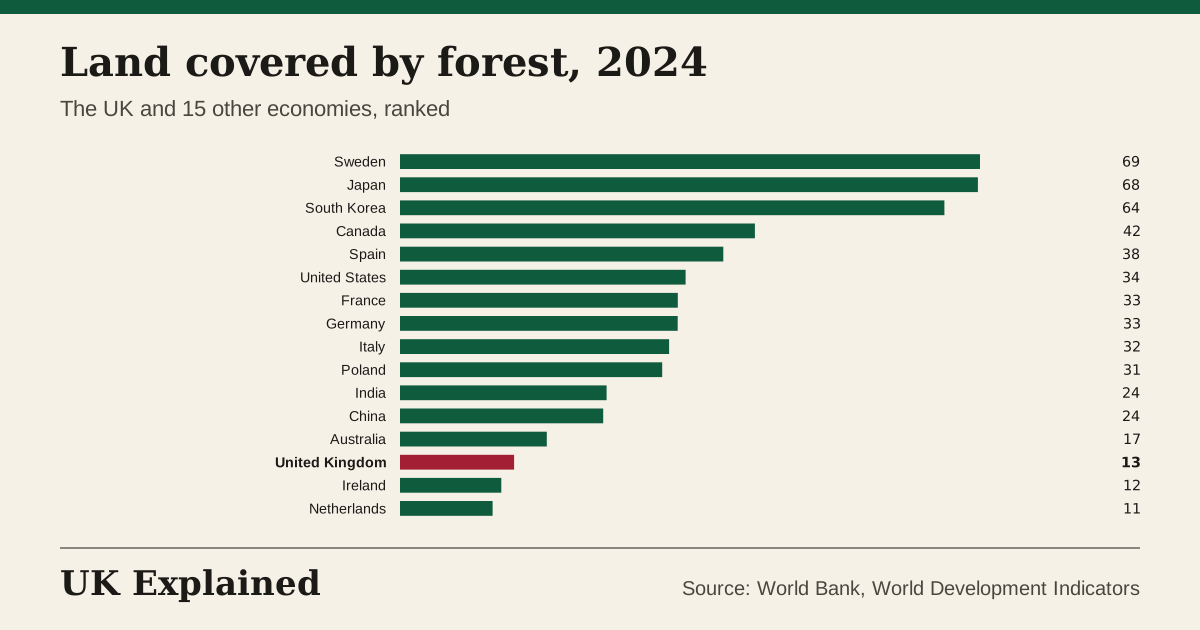
- % of land · 2024 · Source: World Bank, World Development Indicators · Updated 7 November 2026
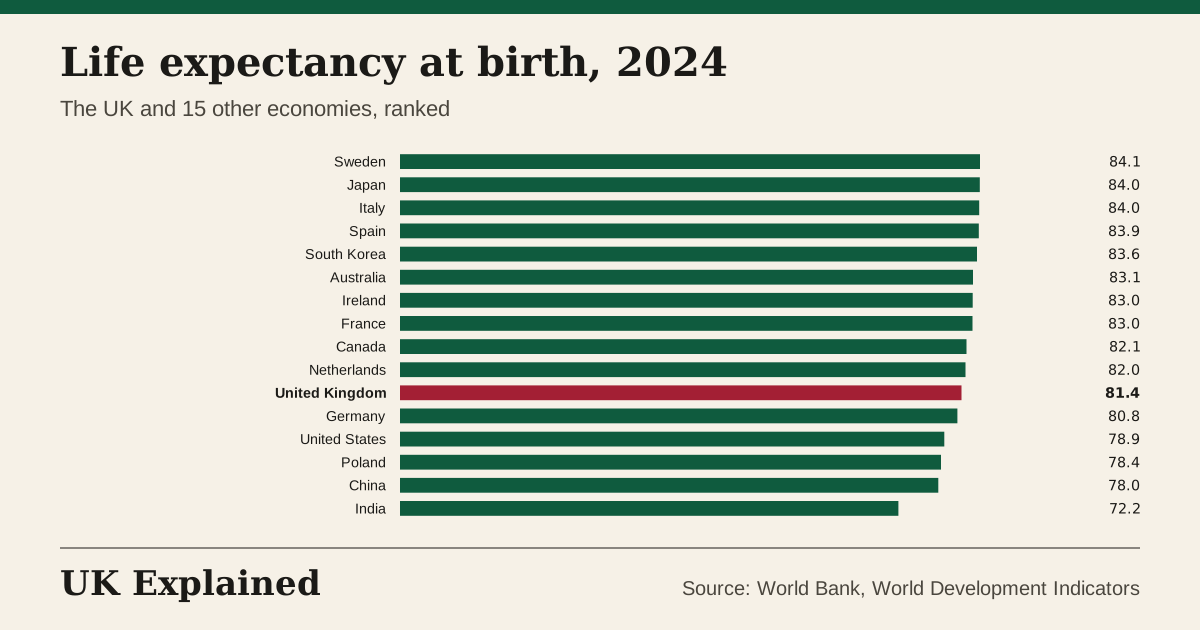
- years · 2024 · Source: World Bank, World Development Indicators · Updated 7 November 2026
- % of GDP · 2025 · Source: World Bank, World Development Indicators · Updated 7 November 2026
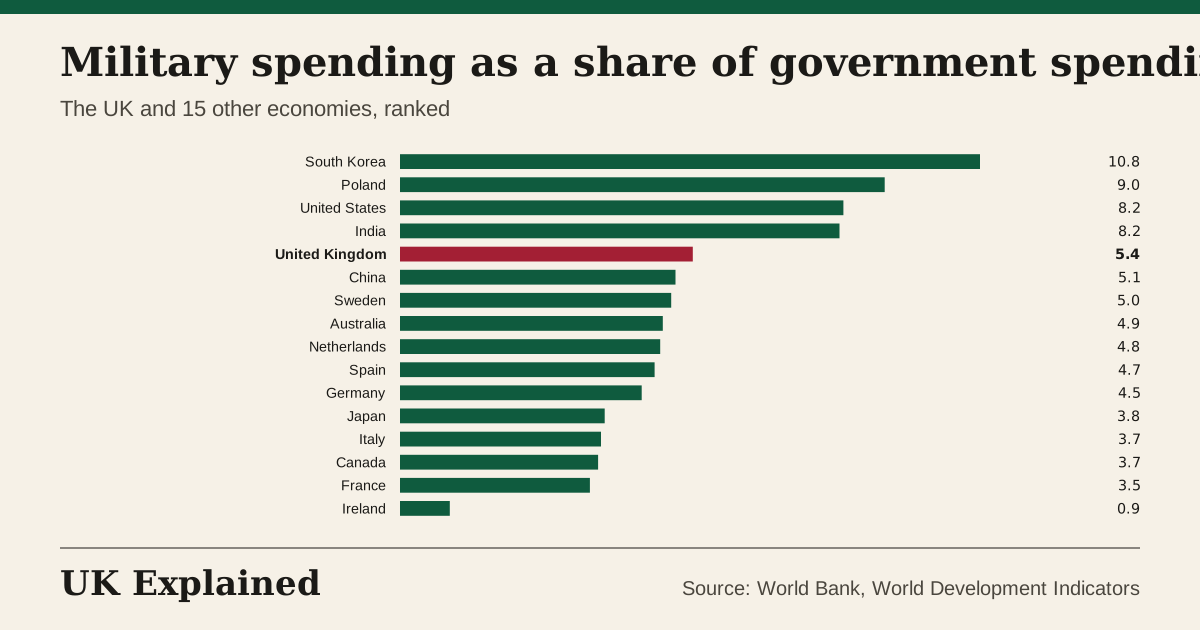
- % of government spending · 2025 · Source: World Bank, World Development Indicators · Updated 7 November 2026
- % of GDP · 2025 · Source: World Bank, World Development Indicators · Updated 7 November 2026
- people over five years · 2025 · Source: World Bank, World Development Indicators · Updated 7 November 2026
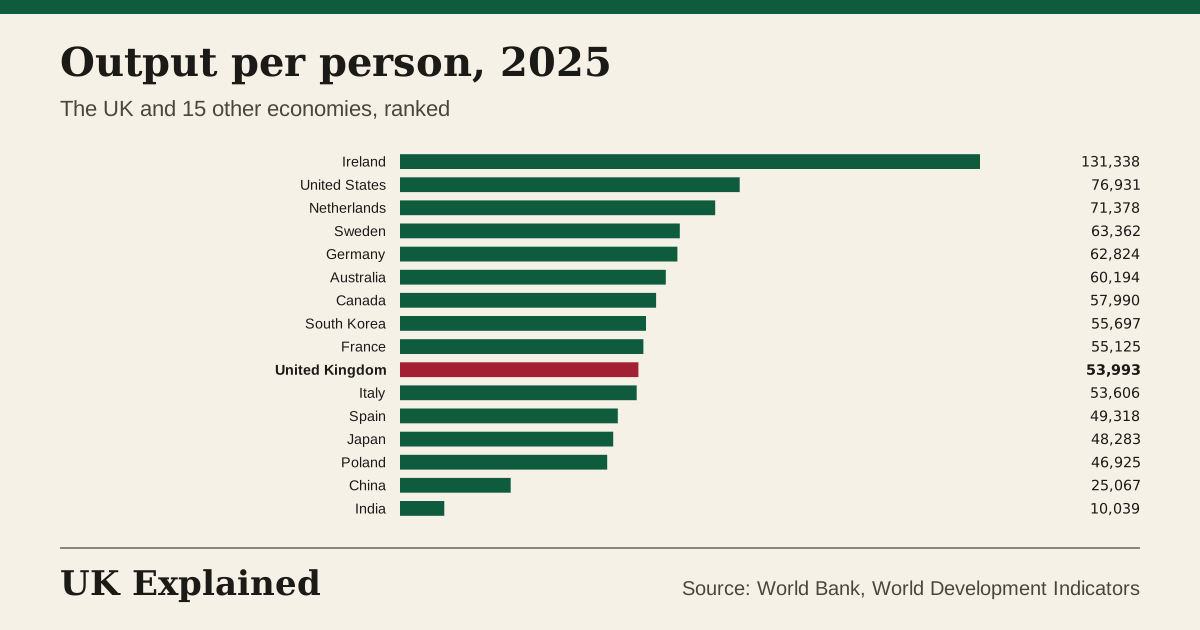
- international $ (2021 prices) · 2025 · Source: World Bank, World Development Indicators · Updated 7 November 2026
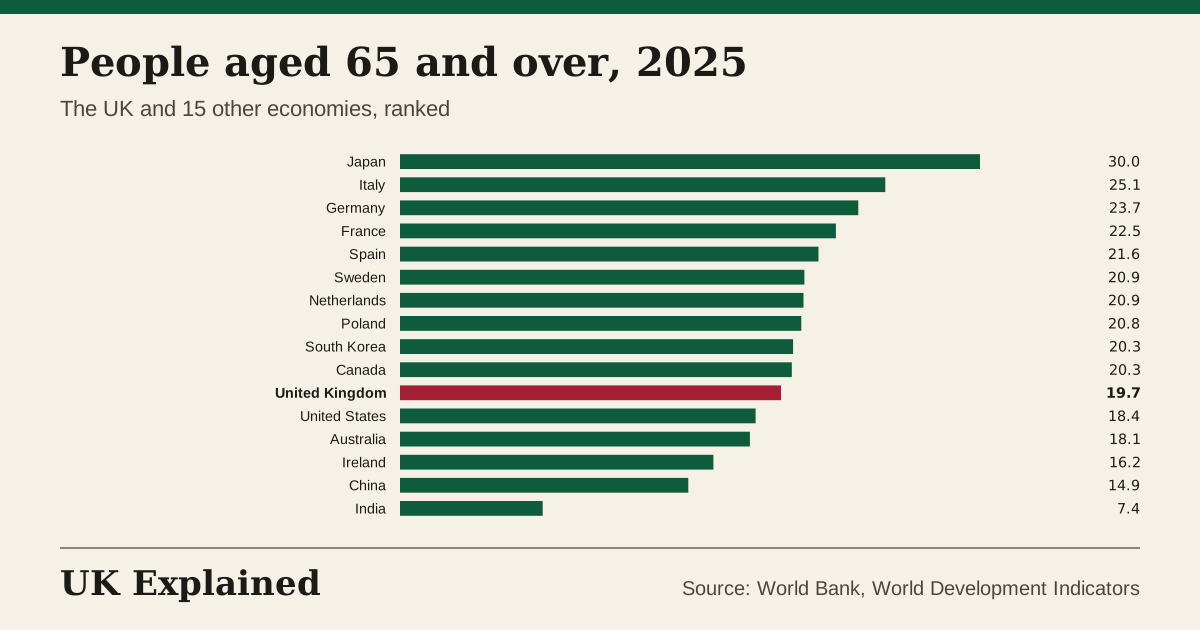
- % of population · 2025 · Source: World Bank, World Development Indicators · Updated 7 November 2026
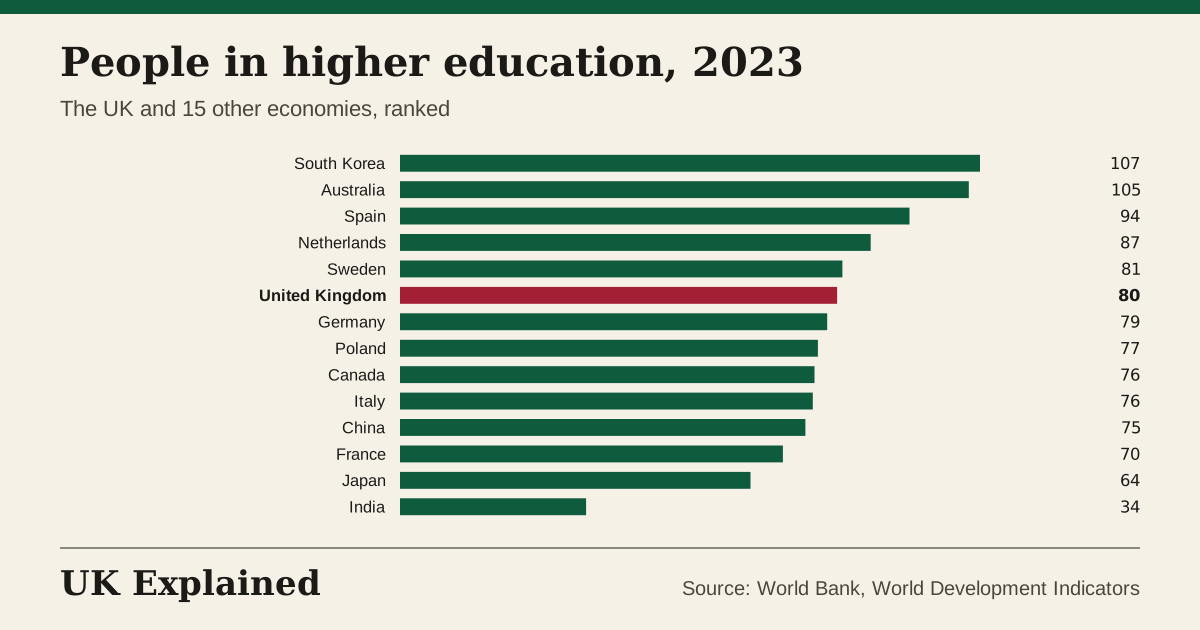
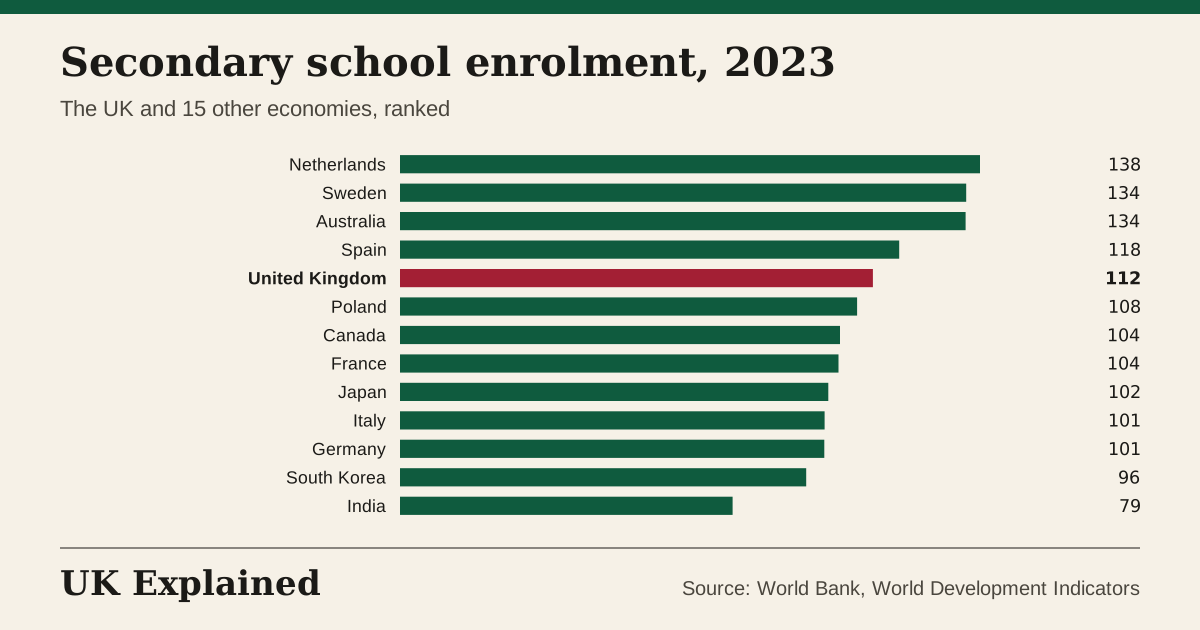
- % of the age group · 2023 · Source: World Bank, World Development Indicators · Updated 7 November 2026
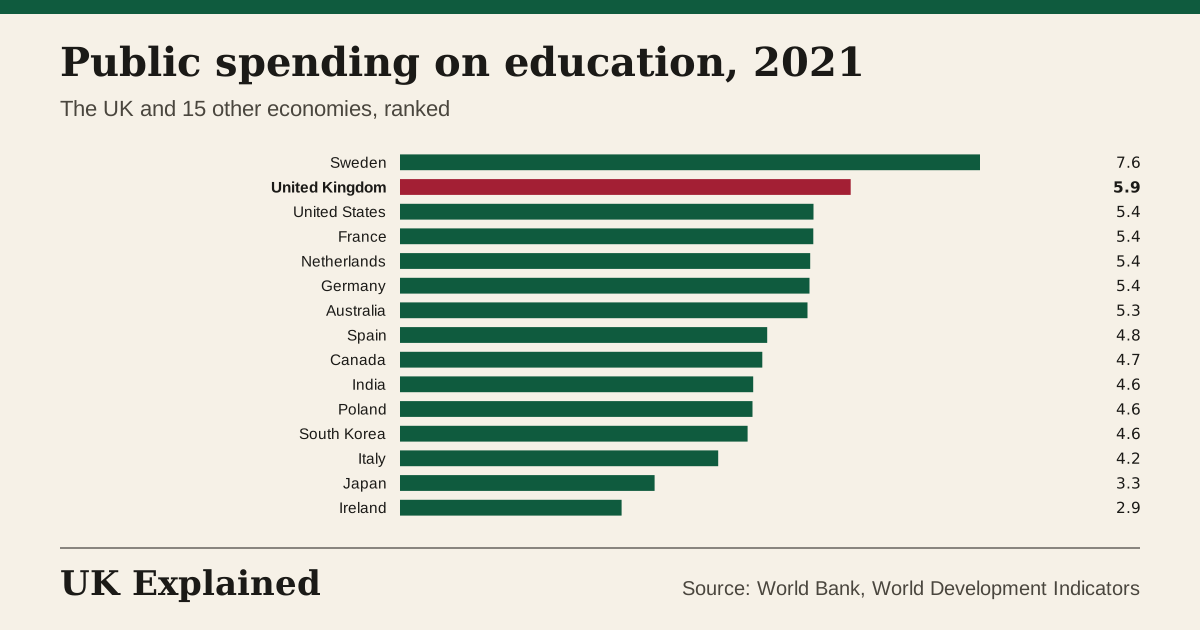
- % of GDP · 2021 · Source: World Bank, World Development Indicators · Updated 7 November 2026
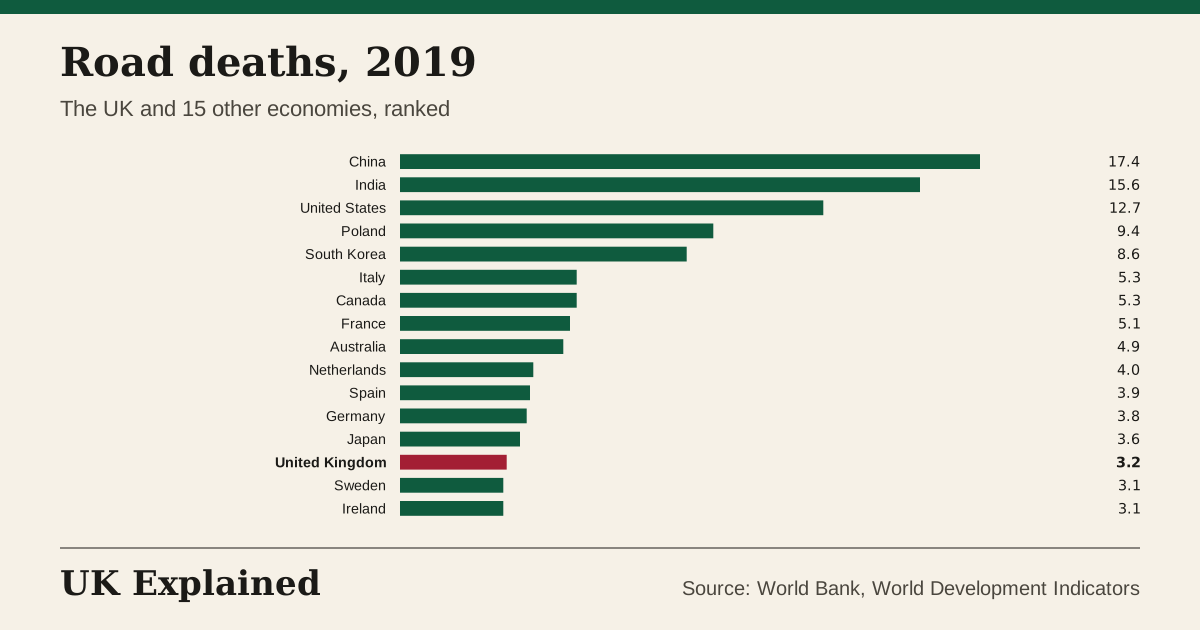
- deaths per 100,000 people · 2019 · Source: World Bank, World Development Indicators · Updated 7 November 2026
- % of the age group · 2023 · Source: World Bank, World Development Indicators · Updated 7 November 2026
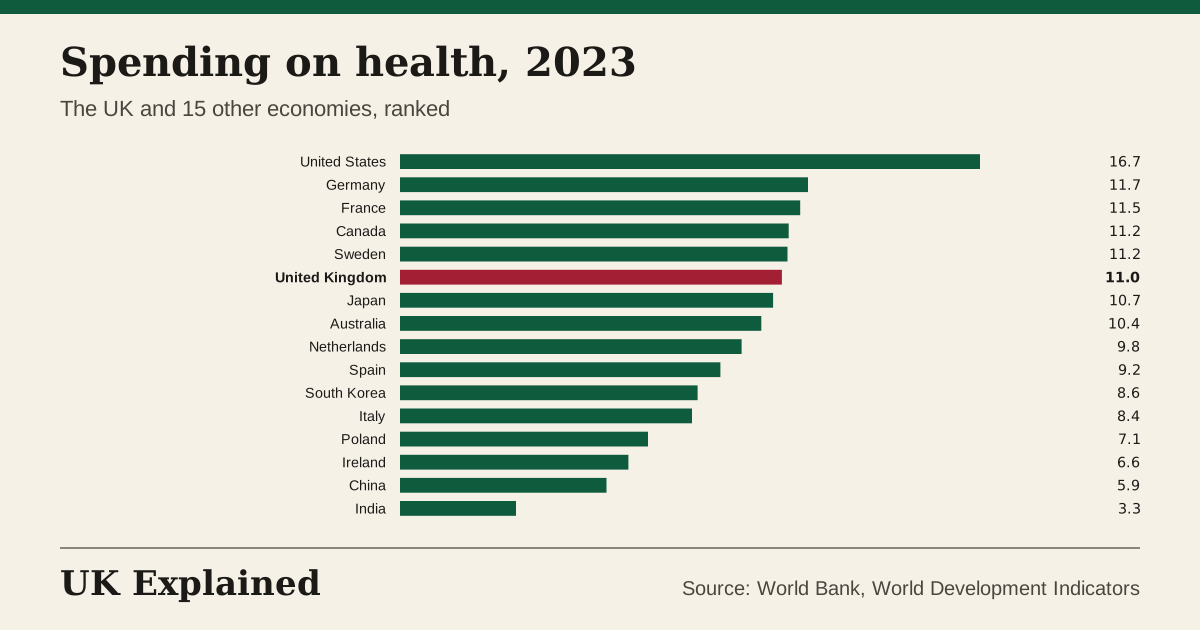
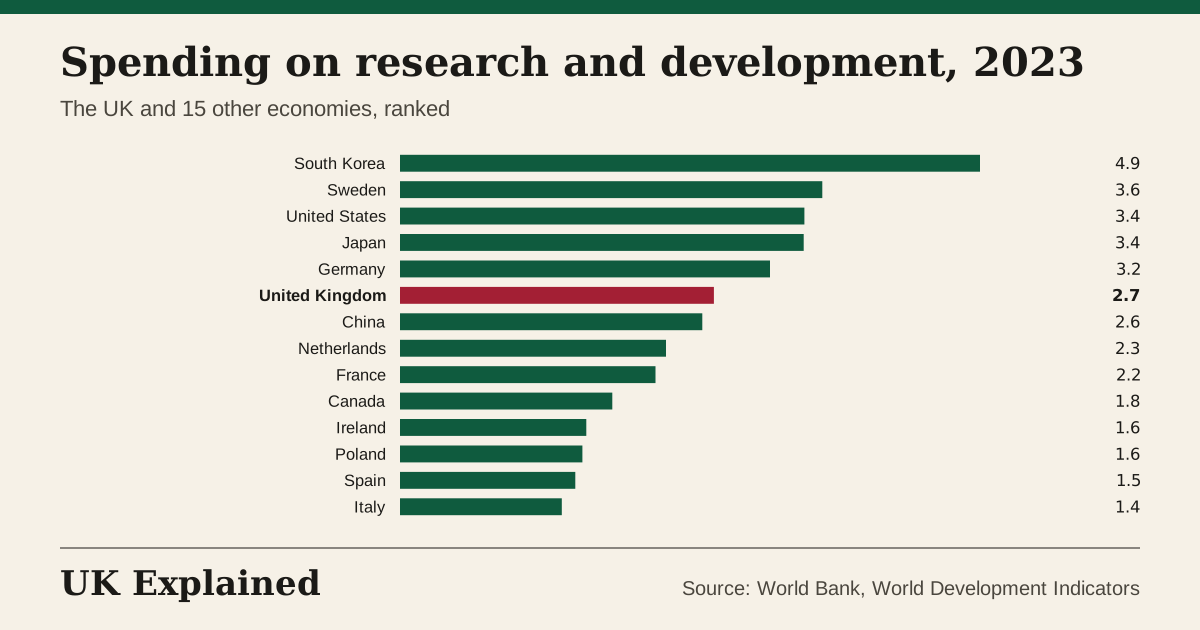
- % of GDP · 2023 · Source: World Bank, World Development Indicators · Updated 7 November 2026
- % of GDP · 2023 · Source: World Bank, World Development Indicators · Updated 7 November 2026
- % and international dollars (see the column names) · 1990 to 2030, IMF estimates from 2026 · Source: IMF World Economic Outlook and Fiscal Monitor · Updated 7 November 2026
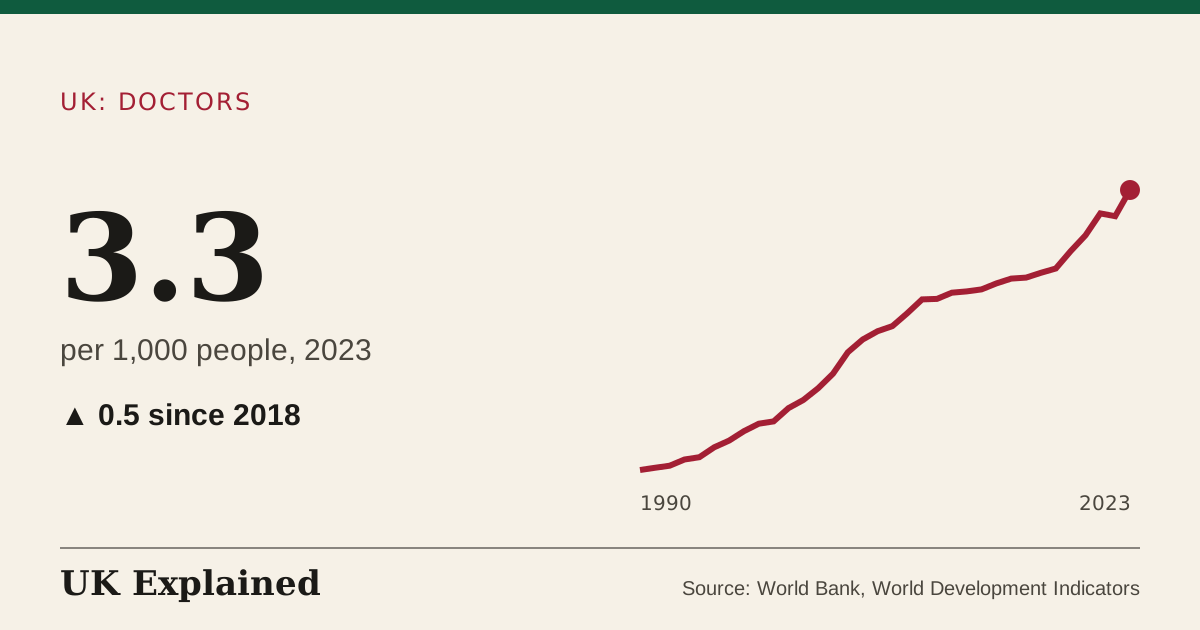
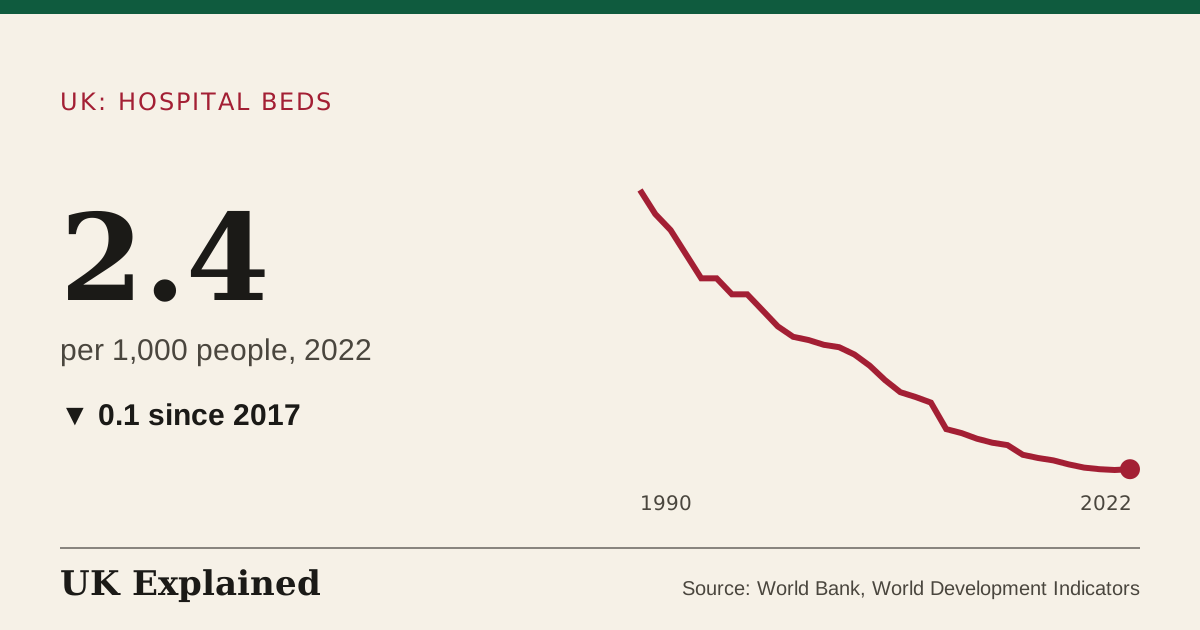
- per 1,000 people · 1990 to 2023 · Source: World Bank, World Development Indicators · Updated 7 November 2026
- per 1,000 people · 1990 to 2022 · Source: World Bank, World Development Indicators · Updated 7 November 2026
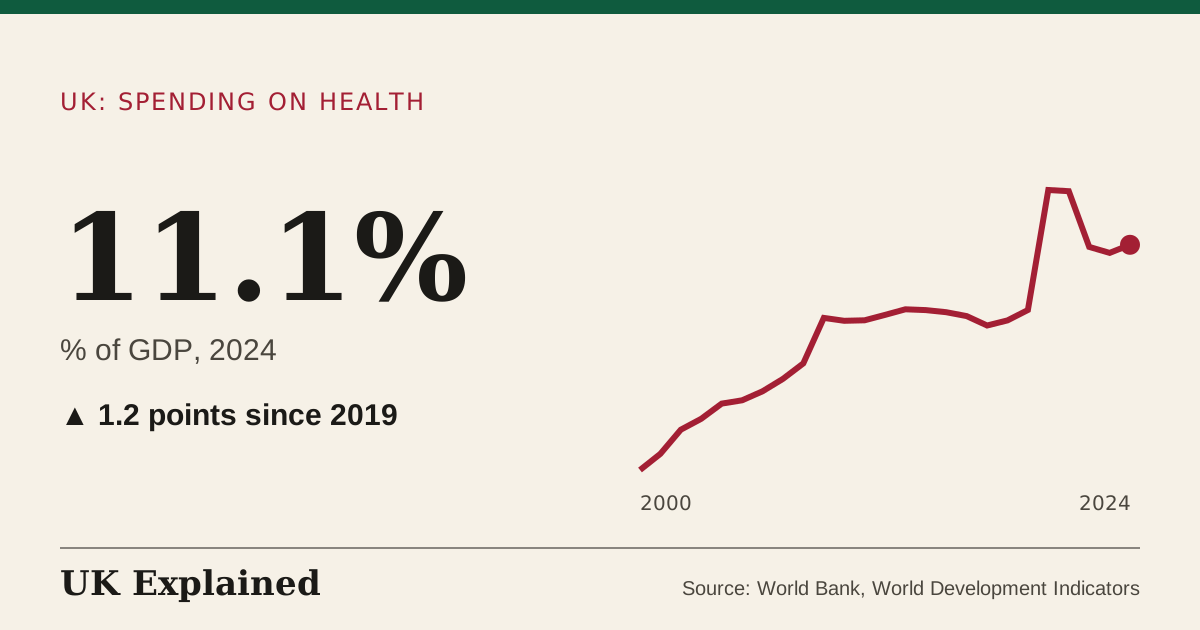
- % of GDP · 2000 to 2024 · Source: World Bank, World Development Indicators · Updated 7 November 2026
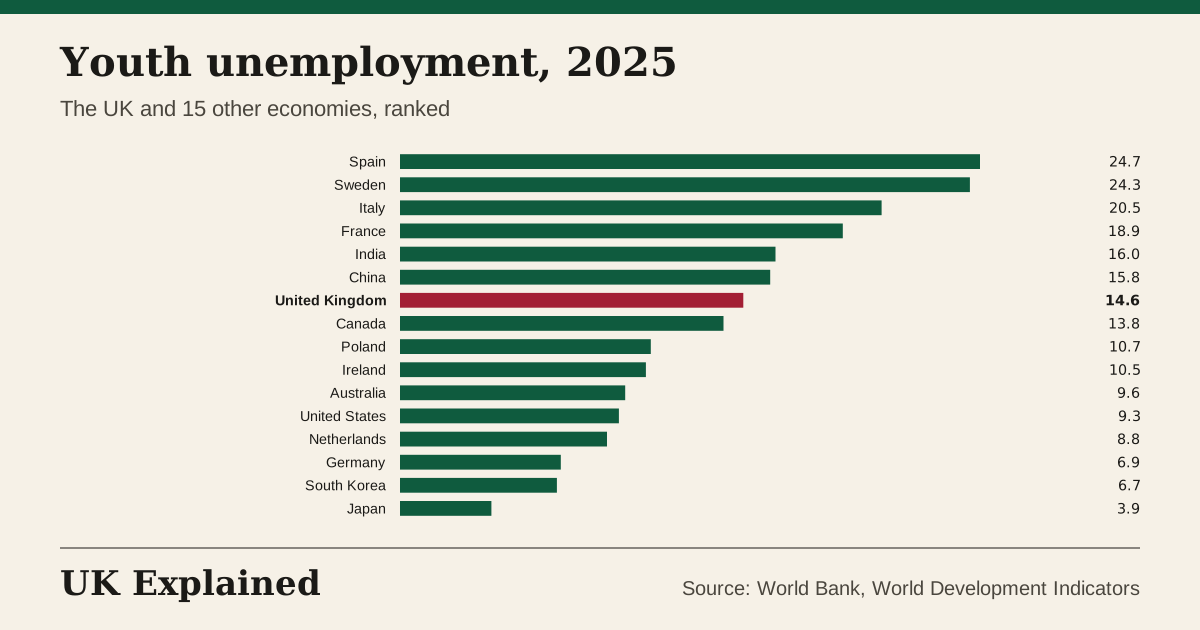
- % of 15 to 24-year-olds in the labour force · 2025 · Source: World Bank, World Development Indicators · Updated 7 November 2026
No dataset matches. Try a shorter word.
Each figure’s freshness: Data status. How we calculate everything: How it works.