How much greenhouse gas does the UK produce?
The UK released 373 million tonnes of greenhouse gases (as carbon dioxide equivalent) in 2024, down 30% on 2014 and well below 791 million tonnes in 1990. Transport produced 110 million tonnes of that.
Million tonnes of CO₂ equivalent, 2024. down 30% on 2014.
Million tonnes, 2024.
Million tonnes, 2024.
Emissions over time
What’s this?
All greenhouse gases released within the UK's borders, counted as the million tonnes of carbon dioxide that would warm the Earth by the same amount.
What it cannot tell you: These are emissions made inside the UK. They leave out emissions from making goods abroad that people in the UK then buy, and from international flights and shipping.
What’s this?
Greenhouse gases from cars, vans, lorries, buses, trains, domestic flights and shipping within the UK.
What it cannot tell you: Sectors follow the way the government counts emissions, so electricity made for homes is counted under electricity, not buildings.
What’s this?
Greenhouse gases from power stations that make electricity.
What it cannot tell you: Sectors follow the way the government counts emissions, so electricity made for homes is counted under electricity, not buildings.
What’s this?
Greenhouse gases from heating homes and offices (mostly burning gas) and from products such as solvents.
What it cannot tell you: Sectors follow the way the government counts emissions, so electricity made for homes is counted under electricity, not buildings.
What’s this?
Greenhouse gases from factories and heavy industry such as steel, cement and chemicals.
What it cannot tell you: Sectors follow the way the government counts emissions, so electricity made for homes is counted under electricity, not buildings.
What’s this?
Greenhouse gases from farm animals, fertiliser and farm machinery.
What it cannot tell you: Sectors follow the way the government counts emissions, so electricity made for homes is counted under electricity, not buildings.
What’s this?
Greenhouse gases from rubbish in landfill and from treating sewage and waste.
What it cannot tell you: Sectors follow the way the government counts emissions, so electricity made for homes is counted under electricity, not buildings.
What’s this?
Carbon dioxide released in the UK, minus what forests and soils absorb.
What it cannot tell you: These are emissions made inside the UK. They leave out emissions from making goods abroad that people in the UK then buy, and from international flights and shipping.
What’s this?
Methane released in the UK, mostly from farm animals, landfill and gas leaks, in million tonnes of carbon dioxide equivalent.
What it cannot tell you: These are emissions made inside the UK. They leave out emissions from making goods abroad that people in the UK then buy, and from international flights and shipping.
Year by year
Million tonnes of carbon dioxide equivalent.
| Period | Total greenhouse gas emissions | Emissions from transport | Emissions from buildings | Emissions from making electricity | Emissions from industry | Emissions from farming | Emissions from waste |
|---|---|---|---|---|---|---|---|
| 2024 | 373 | 110 | 82 | 38 | 46 | 47 | 21 |
| 2023 | 384 | 110 | 79 | 45 | 50 | 47 | 22 |
| 2022 | 404 | 111 | 83 | 55 | 54 | 46 | 22 |
| 2021 | 422 | 110 | 98 | 55 | 58 | 48 | 22 |
| 2020 | 408 | 101 | 93 | 50 | 59 | 48 | 23 |
| 2019 | 448 | 123 | 94 | 58 | 62 | 49 | 25 |
| 2018 | 464 | 126 | 98 | 66 | 63 | 48 | 25 |
| 2017 | 472 | 128 | 94 | 72 | 65 | 51 | 25 |
| 2016 | 483 | 127 | 96 | 82 | 65 | 50 | 24 |
| 2015 | 511 | 123 | 96 | 104 | 71 | 51 | 25 |
| 2014 | 531 | 123 | 94 | 124 | 75 | 50 | 26 |
| 2013 | 573 | 121 | 109 | 148 | 77 | 50 | 28 |
Emissions per person, against other countries
Ranked, using the latest year the World Bank has for most of the 16 economies. The United Kingdom is picked out in the bar colour. Countries differ in size, climate and how they collect the figures, so a rank is a starting point, not a verdict.
Greenhouse gases per person, 2024: UK 13th of 16
All greenhouse gases released in the country in a year, per person, counted as the carbon dioxide that would warm the Earth the same amount. tonnes of CO₂ equivalent.
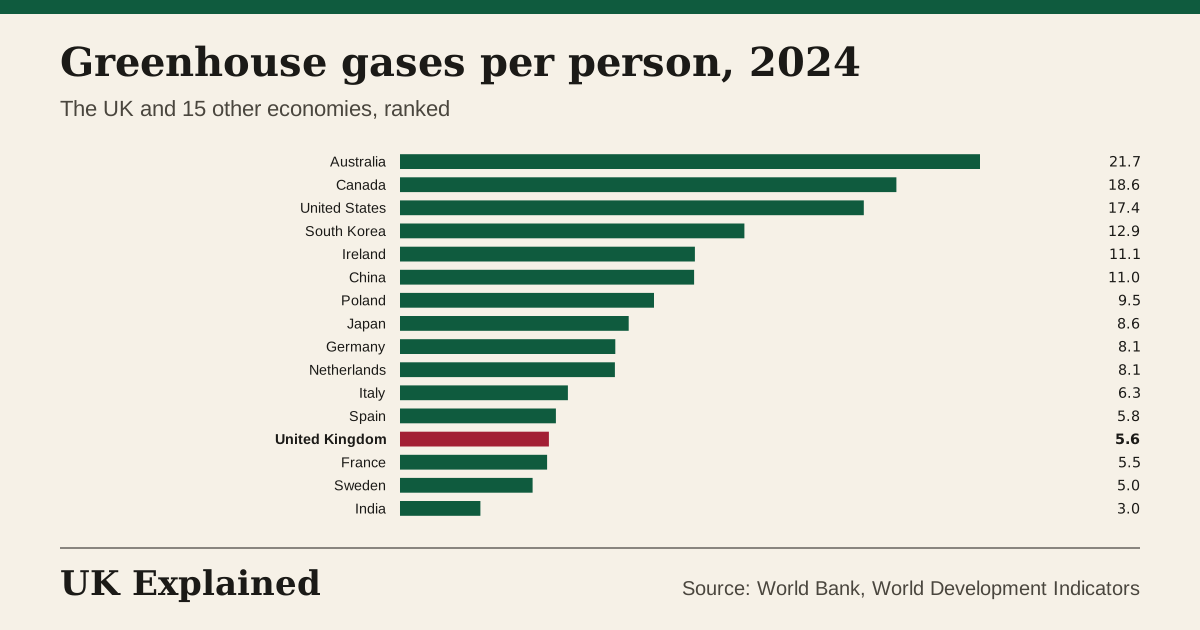
What it cannot tell you: It counts emissions made inside the country, not those from goods made abroad and bought there.
Questions people ask
How much have UK emissions fallen?
From 791 million tonnes in 1990 to 373 in 2024. Most of the fall came from power stations switching from coal, and from the closure of heavy industry.
Which sector produces the most?
In 2024: domestic transport 110 million tonnes, buildings 82, industry 46, farming 47, electricity 38 and waste 21.
Does this include emissions from goods made abroad?
No. These are 'territorial' emissions made inside the UK. They leave out international flights and shipping and the emissions in making goods that are bought in the UK but made elsewhere.
What does “total greenhouse gas emissions” measure?
All greenhouse gases released within the UK's borders, counted as the million tonnes of carbon dioxide that would warm the Earth by the same amount. It was 373 (million tonnes of CO₂ equivalent) in 2024, down 17% on 2019. The highest we have is 801 (1991) and the lowest 373 (2024).
What does “emissions from transport” measure?
Greenhouse gases from cars, vans, lorries, buses, trains, domestic flights and shipping within the UK. It was 110 (million tonnes of CO₂ equivalent) in 2024, down 10% on 2019. The highest we have is 136 (2007) and the lowest 101 (2020).
What does “emissions from making electricity” measure?
Greenhouse gases from power stations that make electricity. It was 38 (million tonnes of CO₂ equivalent) in 2024, down 35% on 2019. The highest we have is 204 (1990) and the lowest 38 (2024).
What does “emissions from buildings” measure?
Greenhouse gases from heating homes and offices (mostly burning gas) and from products such as solvents. It was 82 (million tonnes of CO₂ equivalent) in 2024, down 13% on 2019. The highest we have is 126 (1996) and the lowest 79 (2023).
Sources: Department for Energy Security and Net Zero, UK greenhouse gas emissions statistics and the World Bank. Updated every night. Each chart has a CSV and a Share button.
See also: Where electricity comes from · Energy against other countries