How many people die on Britain's roads?
1,556 people were killed in reported road accidents in Great Britain in 2025, and an estimated 29,911 were killed or seriously injured. That is down 10% on 2015. Car occupants made up 638 of the deaths and pedestrians 372.
People who died within 30 days of an accident, 2025 (provisional).
Adjusted for changes in how injuries are recorded, 2025.
2025.
Road deaths over time
What’s this?
The number of people who died within 30 days of a road accident reported to the police, in Great Britain.
What it cannot tell you: Only accidents reported to the police are counted, so minor injuries are undercounted. The latest year is provisional and may be revised, and traffic fell in 2020 because of the pandemic.
What’s this?
The number of people killed or seriously injured in road accidents reported to the police in Great Britain, adjusted so years can be compared.
What it cannot tell you: Only accidents reported to the police are counted, so minor injuries are undercounted. The latest year is provisional and may be revised, and traffic fell in 2020 because of the pandemic.
What’s this?
The number of people in cars who died in road accidents reported to the police in Great Britain.
What it cannot tell you: Only accidents reported to the police are counted, so minor injuries are undercounted. The latest year is provisional and may be revised, and traffic fell in 2020 because of the pandemic.
What’s this?
The number of pedestrians who died in road accidents reported to the police in Great Britain.
What it cannot tell you: Only accidents reported to the police are counted, so minor injuries are undercounted. The latest year is provisional and may be revised, and traffic fell in 2020 because of the pandemic.
What’s this?
The number of cyclists who died in road accidents reported to the police in Great Britain.
What it cannot tell you: Only accidents reported to the police are counted, so minor injuries are undercounted. The latest year is provisional and may be revised, and traffic fell in 2020 because of the pandemic.
What’s this?
The number of motorcyclists who died in road accidents reported to the police in Great Britain.
What it cannot tell you: Only accidents reported to the police are counted, so minor injuries are undercounted. The latest year is provisional and may be revised, and traffic fell in 2020 because of the pandemic.
Year by year
| Period | People killed on roads | People killed or seriously injured on roads | All road casualties | Pedestrians killed | Cyclists killed | Motorcyclists killed | Car drivers and passengers killed |
|---|---|---|---|---|---|---|---|
| 2025 | 1,556 | 29,911 | 127,870 | 372 | 81 | 384 | 638 |
| 2024 | 1,602 | 28,864 | 128,272 | 409 | 82 | 340 | 692 |
| 2023 | 1,624 | 28,962 | 132,977 | 405 | 87 | 315 | 725 |
| 2022 | 1,711 | 28,913 | 135,480 | 385 | 91 | 350 | 788 |
| 2021 | 1,558 | 26,386 | 128,209 | 361 | 111 | 310 | 682 |
| 2020 | 1,460 | 23,207 | 115,584 | 346 | 141 | 285 | 618 |
| 2019 | 1,752 | 29,734 | 153,158 | 470 | 100 | 336 | 736 |
| 2018 | 1,784 | 30,628 | 160,597 | 456 | 99 | 354 | 777 |
| 2017 | 1,793 | 30,168 | 170,993 | 470 | 101 | 349 | 787 |
| 2016 | 1,792 | 31,102 | 181,384 | 448 | 102 | 319 | 816 |
| 2015 | 1,730 | 32,157 | 186,189 | 408 | 100 | 365 | 754 |
Road deaths, against other countries
Ranked, using the latest year the World Bank has for most of the 16 economies. The United Kingdom is picked out in the bar colour. Countries differ in size, climate and how they collect the figures, so a rank is a starting point, not a verdict.
Road deaths, 2019: UK 14th of 16
The number of people killed in road accidents in a year for every 100,000 people. deaths per 100,000 people.
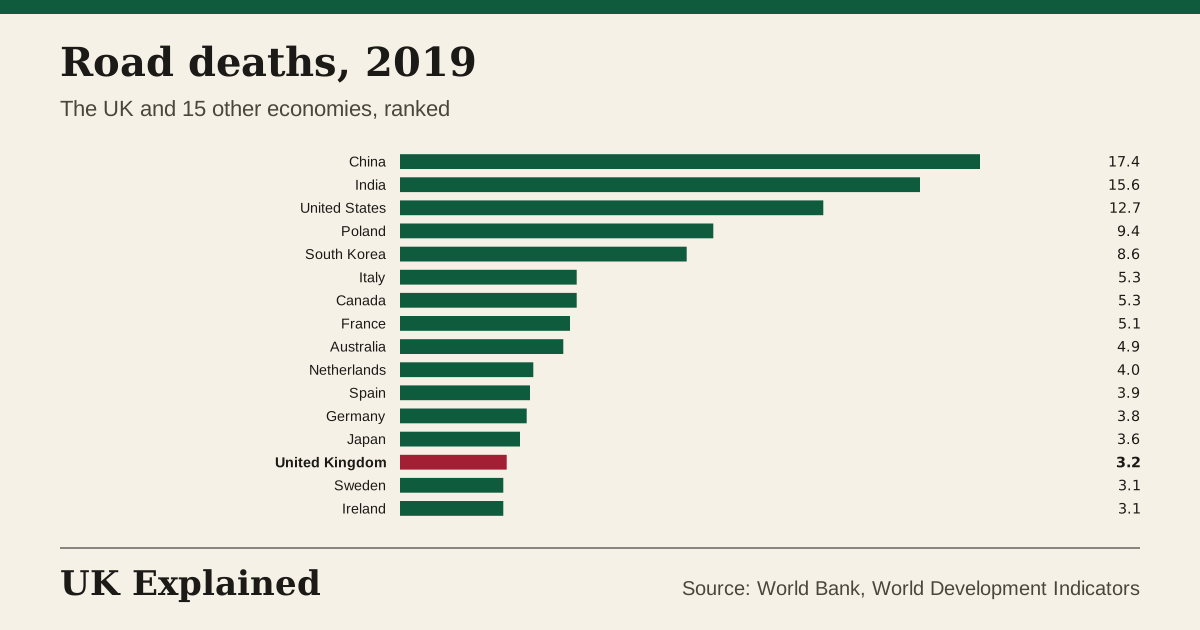
What it cannot tell you: It is not the risk per mile travelled, which is what matters most to a driver, and countries drive different distances.
Questions people ask
How many people die on UK roads each year?
1,556 in Great Britain in 2025, down from a peak of 1,793 in 2017 in our figures. The figures cover Great Britain; Northern Ireland publishes its own.
Are UK roads safe compared with other countries?
The World Bank puts the UK at 3.2 deaths per 100,000 people in 2019, 14th highest of the 16 economies we compare (the middle of the others: 5.1).
Why does the latest figure change?
The latest year is provisional and revised when the full report is published.
What does “people killed on roads” measure?
The number of people who died within 30 days of a road accident reported to the police, in Great Britain. It was 1,556 (people a year) in 2025, up 7% on 2020. The highest we have is 1,793 (2017) and the lowest 1,460 (2020).
What does “people killed or seriously injured on roads” measure?
The number of people killed or seriously injured in road accidents reported to the police in Great Britain, adjusted so years can be compared. It was 29,911 (people a year) in 2025, up 29% on 2020. The highest we have is 32,157 (2015) and the lowest 23,207 (2020).
What does “car drivers and passengers killed” measure?
The number of people in cars who died in road accidents reported to the police in Great Britain. It was 638 (people a year) in 2025, up 3% on 2020. The highest we have is 816 (2016) and the lowest 618 (2020).
What does “pedestrians killed” measure?
The number of pedestrians who died in road accidents reported to the police in Great Britain. It was 372 (people a year) in 2025, up 8% on 2020. The highest we have is 470 (2017) and the lowest 346 (2020).
Sources: Department for Transport, reported road casualties Great Britain and the World Bank. Updated every night. Each chart has a CSV and a Share button.
See also: