How unequal are incomes in the UK?
The UK's Gini index, a score for how unequally income is shared, was 32.4 in 2021, 7th highest of the 13 economies we compare (0 is perfect equality, 100 is one person having everything). The richest tenth took 25% of income.
2021. 7th highest of the 13 economies we compare.
Of income, 2021. 5th highest of the 13 economies we compare.
People aged 15 to 24 looking for work, 2025.
UK over time
What’s this?
A single score for how unequally income is shared, from 0 (everyone has the same) to 100 (one person has everything).
What it cannot tell you: Countries are measured in slightly different ways, and one number cannot show where the gaps are.
What’s this?
People aged 15 to 24 who want a job and cannot find one, as a share of young people who work or are looking.
What it cannot tell you: Many young people are in education and are left out, so the rate can look high on a small base.
Against other countries
Ranked, using the latest year the World Bank has for most of the 16 economies. The United Kingdom is picked out in the bar colour. Countries differ in size, climate and how they collect the figures, so a rank is a starting point, not a verdict.
Income inequality (Gini index), 2021: UK 7th of 13
A single score for how unequally income is shared, from 0 (everyone has the same) to 100 (one person has everything). 0 = equal, 100 = unequal.
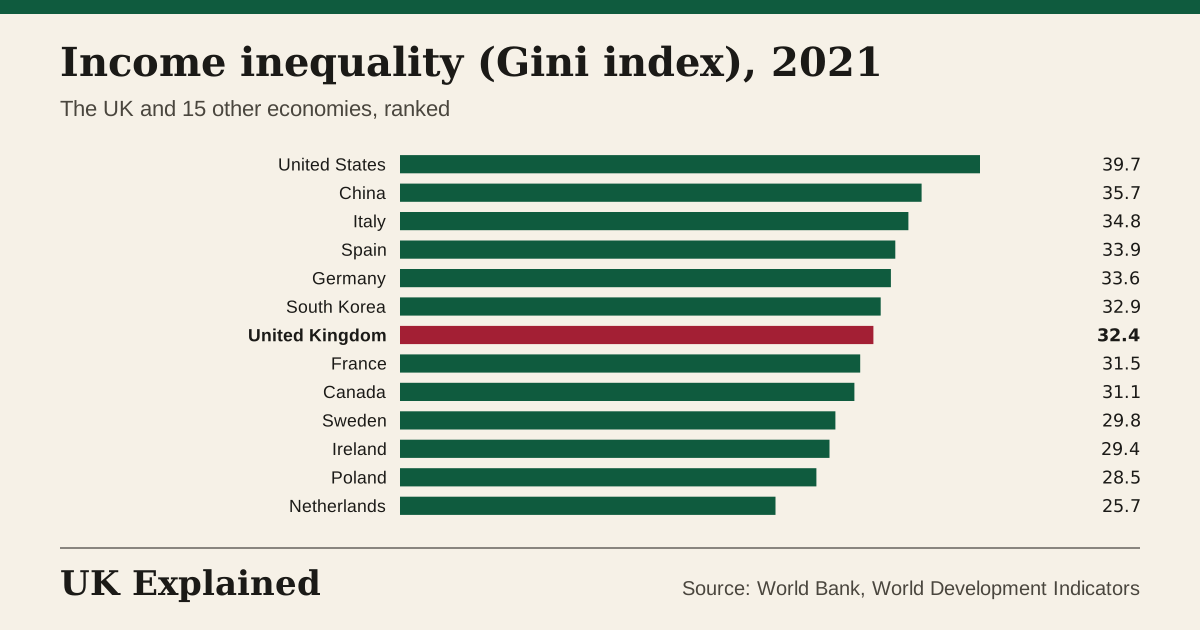
What it cannot tell you: Countries are measured in slightly different ways, and one number cannot show where the gaps are.
Income share of the richest tenth, 2021: UK 5th of 13
The share of all income that goes to the richest 10% of people. % of income.
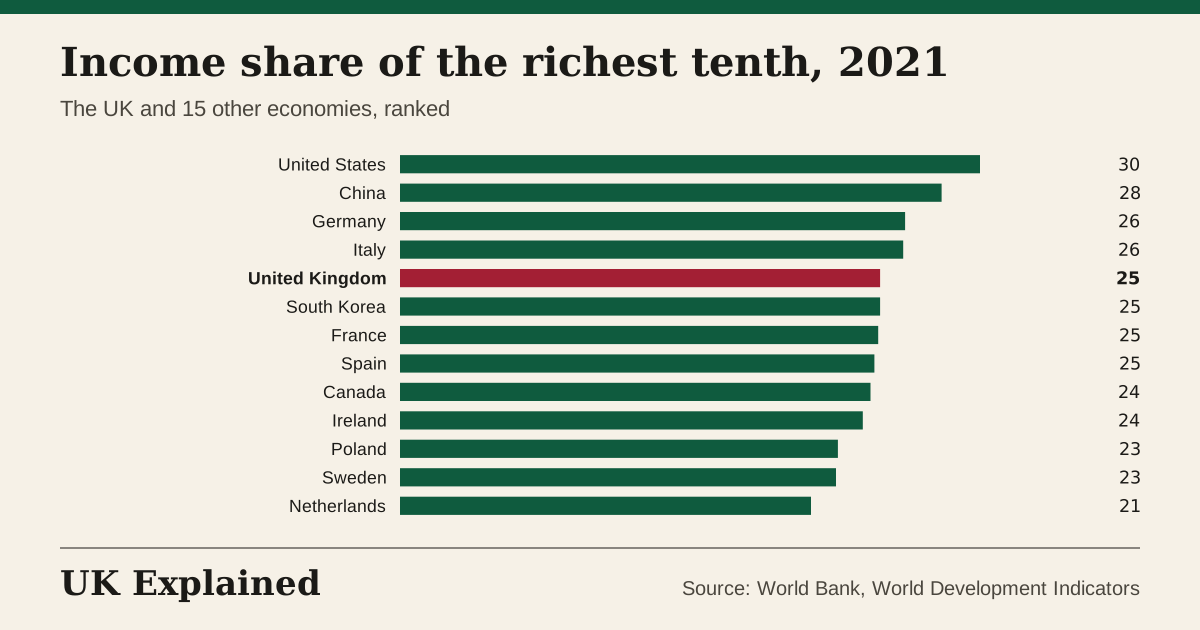
What it cannot tell you: Surveys miss some very high incomes, so shares at the top are probably higher than reported.
Youth unemployment, 2025: UK 7th of 16
People aged 15 to 24 who want a job and cannot find one, as a share of young people who work or are looking. % of 15 to 24-year-olds in the labour force.
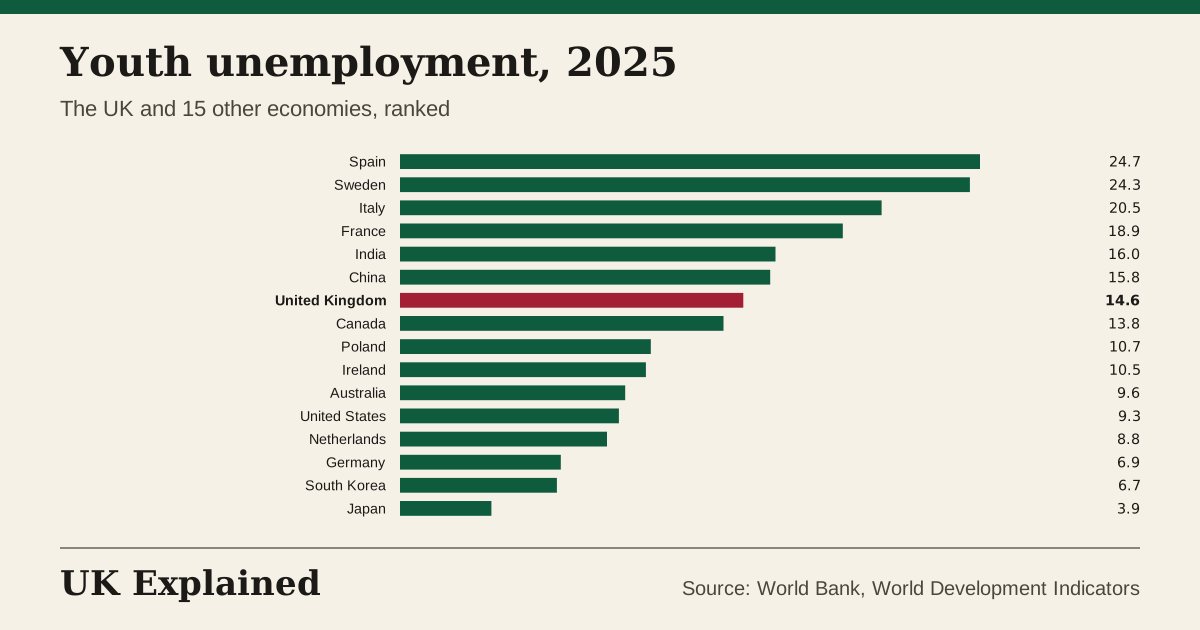
What it cannot tell you: Many young people are in education and are left out, so the rate can look high on a small base.
Questions people ask
What is the Gini index?
A score from 0 to 100 for how unequally income is shared. The UK scored 32.4 in 2021; the middle of the other 15 economies scored 32.9.
Does this include benefits and taxes?
The World Bank uses household surveys that measure income in some countries and spending in others, so small gaps in rank may not mean much.
What does “uk: income inequality (gini index)” measure?
A single score for how unequally income is shared, from 0 (everyone has the same) to 100 (one person has everything). It was 32.4 (0 = equal, 100 = unequal) in 2021, down 2% on 2016. The highest we have is 38.9 (2000) and the lowest 32.4 (2021).
What does “uk: income share of the richest tenth” measure?
The share of all income that goes to the richest 10% of people. It was 25% (% of income) in 2021, down 0.5 points on 2016. The highest we have is 31% (2000) and the lowest 25% (2020).
What does “uk: youth unemployment” measure?
People aged 15 to 24 who want a job and cannot find one, as a share of young people who work or are looking. It was 14.6% (% of 15 to 24-year-olds in the labour force) in 2025, up 1.3 points on 2020. The highest we have is 22.1% (2012) and the lowest 10.2% (2001).
Sources: World Bank, World Development Indicators and the World Bank. Updated every night. Each chart has a CSV and a Share button.
See also: The UK against other countries