How much does the UK economy produce for each person?
The UK economy produced £10,234 per person in Q2 2026, up 12% on Q1 2021. Adjusting for prices between countries, output per person was $53,993 in 2025, 10th highest of the 16 economies we compare.
Pounds a quarter, adjusted for prices, Q2 2026.
A year, adjusted for prices between countries, 2025. 10th highest of the 16 economies we compare.
Index, 2023 = 100, Q1 2026. Output per hour worked was 0.5% higher than a year earlier.
Output per person and per hour over time
What’s this?
The UK economy's output in a quarter divided by the number of people, at constant prices. A rough measure of how productive the average person is.
What it cannot tell you: It is an average: it says nothing about differences between people or places, and it counts people of all ages.
What’s this?
How much the whole UK economy produces for each hour worked, with 2023 set to 100. It is the main measure of productivity.
What it cannot tell you: It is an average for the whole economy and is revised often. It does not show whether workers or owners gain from higher productivity.
What’s this?
How much more the UK economy produced for each hour worked than a year earlier.
What it cannot tell you: Quarterly figures are volatile and revised, so look at the trend over several years rather than one quarter.
What’s this?
What the economy produces for each person, adjusted for differences in prices between countries.
What it cannot tell you: It is an average, and it says nothing about who gets the money or about wellbeing.
What’s this?
What businesses, government and universities together spend on research and development, as a share of the economy.
What it cannot tell you: It counts money spent, not what is discovered.
Against other countries
Ranked, using the latest year the World Bank has for most of the 16 economies. The United Kingdom is picked out in the bar colour. Countries differ in size, climate and how they collect the figures, so a rank is a starting point, not a verdict.
Output per person, 2025: UK 10th of 16
What the economy produces for each person, adjusted for differences in prices between countries. international $ (2021 prices).
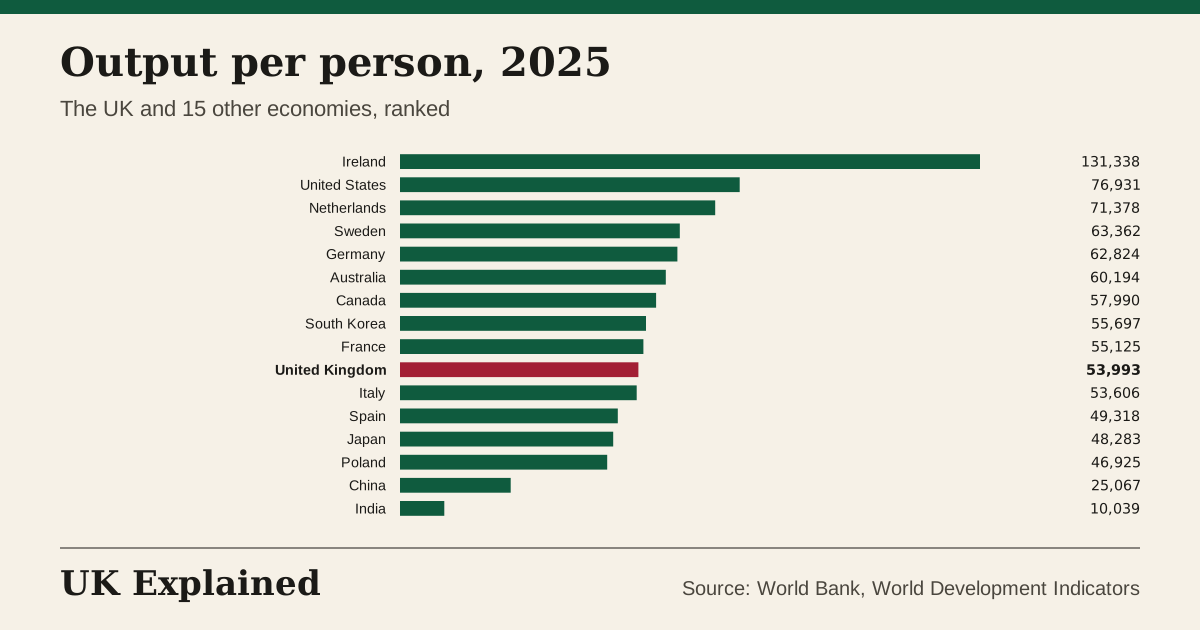
What it cannot tell you: It is an average, and it says nothing about who gets the money or about wellbeing.
Spending on research and development, 2023: UK 6th of 14
What businesses, government and universities together spend on research and development, as a share of the economy. % of GDP.
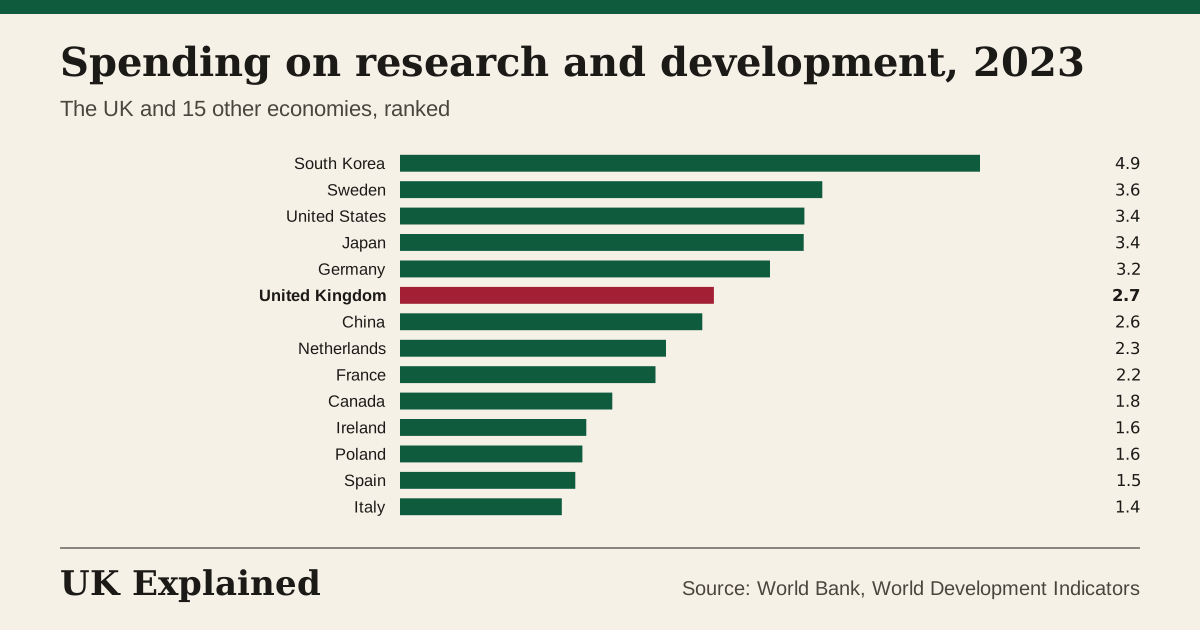
What it cannot tell you: It counts money spent, not what is discovered.
Manufacturing, 2025: UK 12th of 13
The value made by factories, as a share of everything the economy produces. % of GDP.
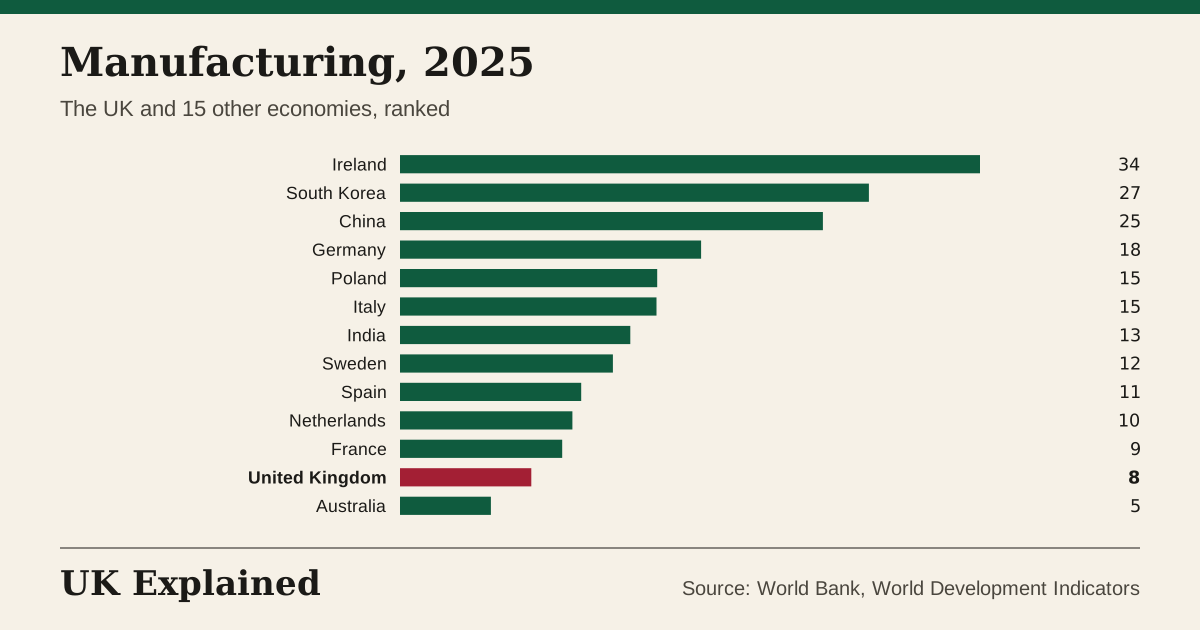
What it cannot tell you: It excludes services linked to manufacturing, such as design and software.
Questions people ask
What is GDP per head?
Everything the economy produces in a period divided by the number of people. It is a rough measure of output, not income, and it says nothing about how that output is shared.
What is productivity?
Output per hour worked across the whole economy. On the ONS index (2023 = 100) it was 100.1 in Q1 2026, up 7% on Q1 2016. Output per hour worked was 0.5% higher than a year earlier.
Is the UK richer than France or Germany?
Of the 16 economies here, the UK is 10th highest of the 16 economies we compare on output per person adjusted for prices. The top is Ireland at 131,338.
What does “economic output per person” measure?
The UK economy's output in a quarter divided by the number of people, at constant prices. A rough measure of how productive the average person is. It was £10,234 (£ a quarter, per head, adjusted for prices) in Q2 2026, up 12% on Q1 2021. The highest we have is £10,234 (Q2 2026) and the lowest £6,473 (Q2 1992).
What does “output per hour worked, index (2023 = 100)” measure?
How much the whole UK economy produces for each hour worked, with 2023 set to 100. It is the main measure of productivity. It was 100.1 (index, 2023 = 100) in Q1 2026, up 1% on Q1 2021. The highest we have is 102.4 (Q3 2020) and the lowest 63.4 (Q1 1990).
What does “output per hour worked, yearly change” measure?
How much more the UK economy produced for each hour worked than a year earlier. It was 0.5% (% a year) in Q1 2026, down 0.9 points on Q1 2021. The highest we have is 5.5% (Q1 2000) and the lowest −3.5% (Q2 2009).
What does “uk: output per person” measure?
What the economy produces for each person, adjusted for differences in prices between countries. It was 53,993 (international $ (2021 prices)) in 2025, up 13% on 2020. The highest we have is 53,993 (2025) and the lowest 32,995 (1991).
Sources: ONS; World Bank, World Development Indicators and the World Bank. Updated every night. Each chart has a CSV and a Share button.
See also: The size of the economy · Economic growth · The UK against other countries