What does the UK sell to and buy from the world?
In Q2 2026 the UK sold £244bn of goods and services abroad and bought £257bn, a trade balance of −£12.8bn. Exports were 31% of GDP in 2025, 11th highest of the 14 economies we compare.
A quarter's goods and services sold abroad, Q2 2026.
A quarter's goods and services bought from abroad, Q2 2026.
Exports minus imports, Q2 2026. A minus sign means the UK bought more than it sold.
Trade over time
What’s this?
What the UK sold to the rest of the world in a quarter, goods and services together.
What it cannot tell you: Prices are not adjusted for inflation, and the figure includes goods that pass through the UK.
What’s this?
What the UK bought from the rest of the world in a quarter, goods and services together.
What it cannot tell you: Prices are not adjusted for inflation, and the figure includes goods that pass through the UK.
What’s this?
Exports minus imports of goods and services. A minus sign means the UK bought more from abroad than it sold.
What it cannot tell you: A trade deficit is not automatically bad: it is balanced by money flowing in as investment and by what the UK earns on assets abroad.
Quarter by quarter
Billions of pounds, seasonally adjusted, not adjusted for prices.
| Period | UK exports of goods and services | UK imports of goods and services | UK trade balance |
|---|---|---|---|
| Q2 2026 | £244bn | £257bn | −£12.8bn |
| Q1 2026 | £235bn | £251bn | −£16.2bn |
| Q4 2025 | £231bn | £243bn | −£12.3bn |
| Q3 2025 | £228bn | £237bn | −£8.6bn |
| Q2 2025 | £225bn | £236bn | −£10.9bn |
| Q1 2025 | £229bn | £237bn | −£7.6bn |
| Q4 2024 | £219bn | £229bn | −£10.0bn |
| Q3 2024 | £222bn | £222bn | £0.3bn |
| Q2 2024 | £223bn | £233bn | −£9.7bn |
| Q1 2024 | £218bn | £219bn | −£1.7bn |
| Q4 2023 | £219bn | £225bn | −£5.9bn |
| Q3 2023 | £216bn | £221bn | −£4.8bn |
Trade, against other countries
Ranked, using the latest year the World Bank has for most of the 16 economies. The United Kingdom is picked out in the bar colour. Countries differ in size, climate and how they collect the figures, so a rank is a starting point, not a verdict.
Exports, 2025: UK 11th of 14
What a country sells abroad, goods and services together, as a share of everything the economy produces. % of GDP.
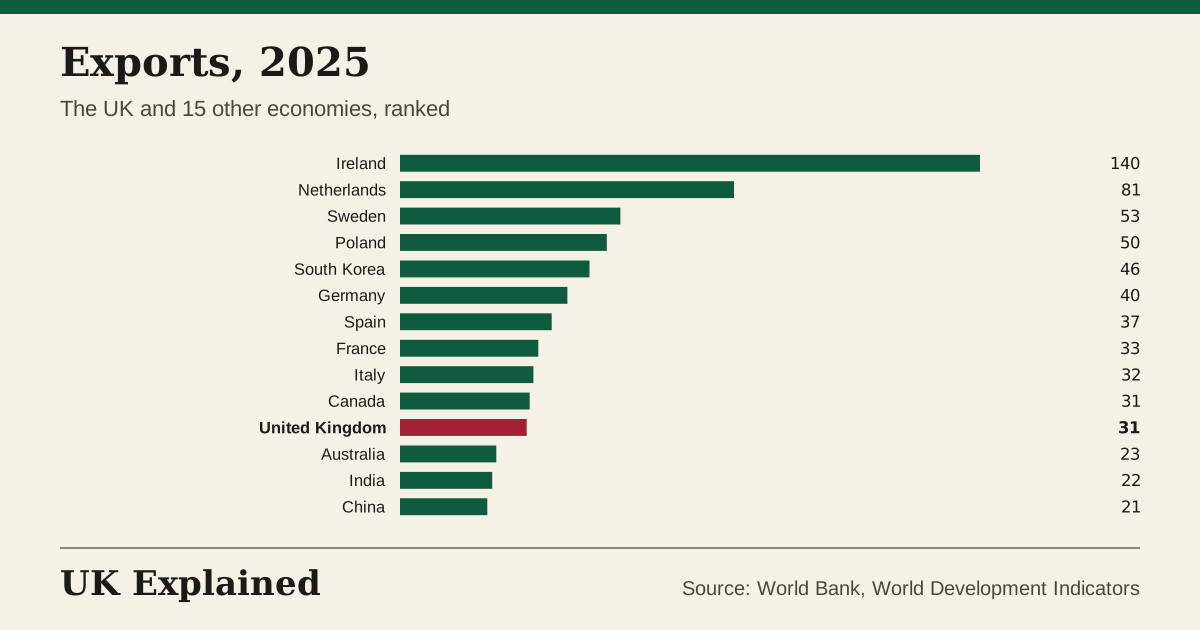
What it cannot tell you: Small countries trade more with their neighbours, so a high share does not mean a country is better off.
Imports, 2025: UK 10th of 14
What a country buys from abroad, goods and services together, as a share of everything the economy produces. % of GDP.
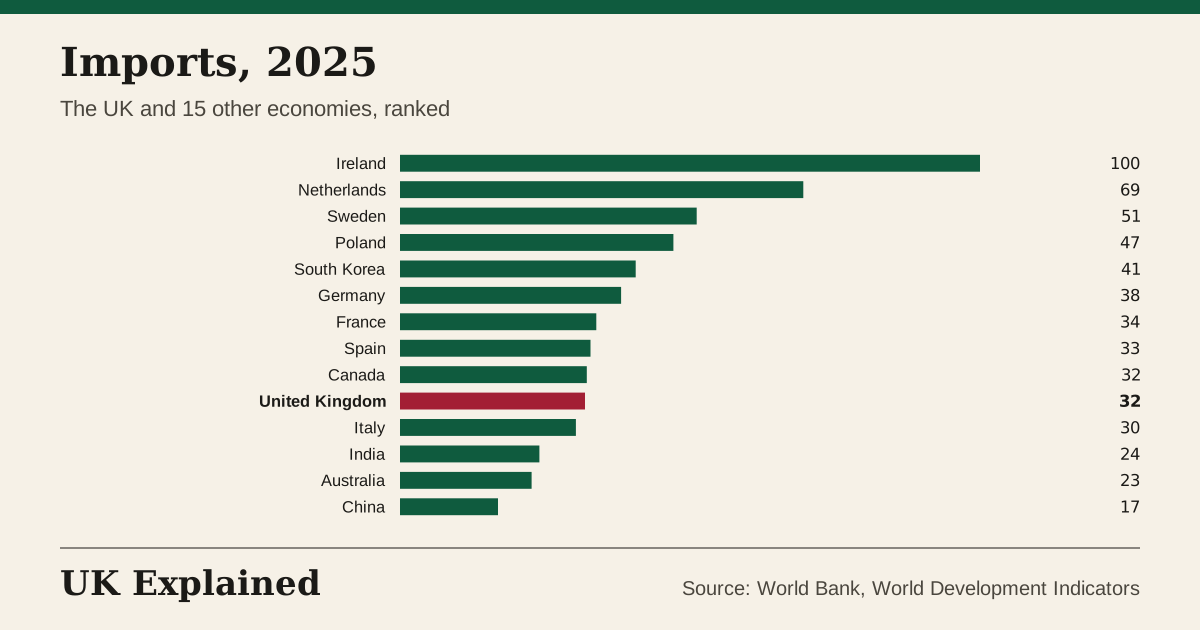
What it cannot tell you: Small countries trade more with their neighbours, so a high share does not mean a country depends on others more.
Questions people ask
Does the UK export more than it imports?
No: in Q2 2026 the UK imported £257bn and exported £244bn, a balance of −£12.8bn. The UK has run a deficit in goods for decades, partly offset by a surplus in services.
What are the UK's biggest exports?
This page shows totals. The ONS publishes the split by product and country in its trade bulletin.
What does “uk exports of goods and services” measure?
What the UK sold to the rest of the world in a quarter, goods and services together. It was £244bn (£ billion a quarter) in Q2 2026, up 56% on Q1 2021. The highest we have is £244bn (Q2 2026) and the lowest £35bn (Q1 1991).
What does “uk imports of goods and services” measure?
What the UK bought from the rest of the world in a quarter, goods and services together. It was £257bn (£ billion a quarter) in Q2 2026, up 64% on Q1 2021. The highest we have is £257bn (Q2 2026) and the lowest £36bn (Q1 1991).
What does “uk trade balance” measure?
Exports minus imports of goods and services. A minus sign means the UK bought more from abroad than it sold. It was −£12.8bn (£ billion a quarter (minus means imports exceed exports)) in Q2 2026, up 7036% on Q1 2021. The highest we have is £22.0bn (Q2 2020) and the lowest −£26.3bn (Q1 2022).
What does “uk: exports” measure?
What a country sells abroad, goods and services together, as a share of everything the economy produces. It was 31% (% of GDP) in 2025, up 0.6 points on 2020. The highest we have is 34% (2022) and the lowest 23% (1991).
Sources: ONS; World Bank, World Development Indicators and the World Bank. Updated every night. Each chart has a CSV and a Share button.
See also: Government money · Jobs and growth · The UK against other countries