How does the UK's environment compare with other countries?
Each person in the UK was responsible for 5.6 tonnes of greenhouse gases in 2024 (13th highest of the 16 economies we compare). Fine particle air pollution averaged 9.5 micrograms per cubic metre, and 13% of the land was forest.
Tonnes, 2024. 13th highest of the 16 economies we compare.
Micrograms per cubic metre, 2023. 8th highest of the 16 economies we compare.
Of land area, 2023. 14th highest of the 16 economies we compare.
UK over time
What’s this?
All greenhouse gases released in the country in a year, per person, counted as the carbon dioxide that would warm the Earth the same amount.
What it cannot tell you: It counts emissions made inside the country, not those from goods made abroad and bought there.
What’s this?
The average level of tiny polluting particles (PM2.5) that people breathe in, which are linked to heart and lung disease.
What it cannot tell you: It is a national average, so it hides the worst places, such as busy roads and cities.
Against other countries
Ranked, using the latest year the World Bank has for most of the 16 economies. The United Kingdom is picked out in the bar colour. Countries differ in size, climate and how they collect the figures, so a rank is a starting point, not a verdict.
Greenhouse gases per person, 2024: UK 13th of 16
All greenhouse gases released in the country in a year, per person, counted as the carbon dioxide that would warm the Earth the same amount. tonnes of CO₂ equivalent.
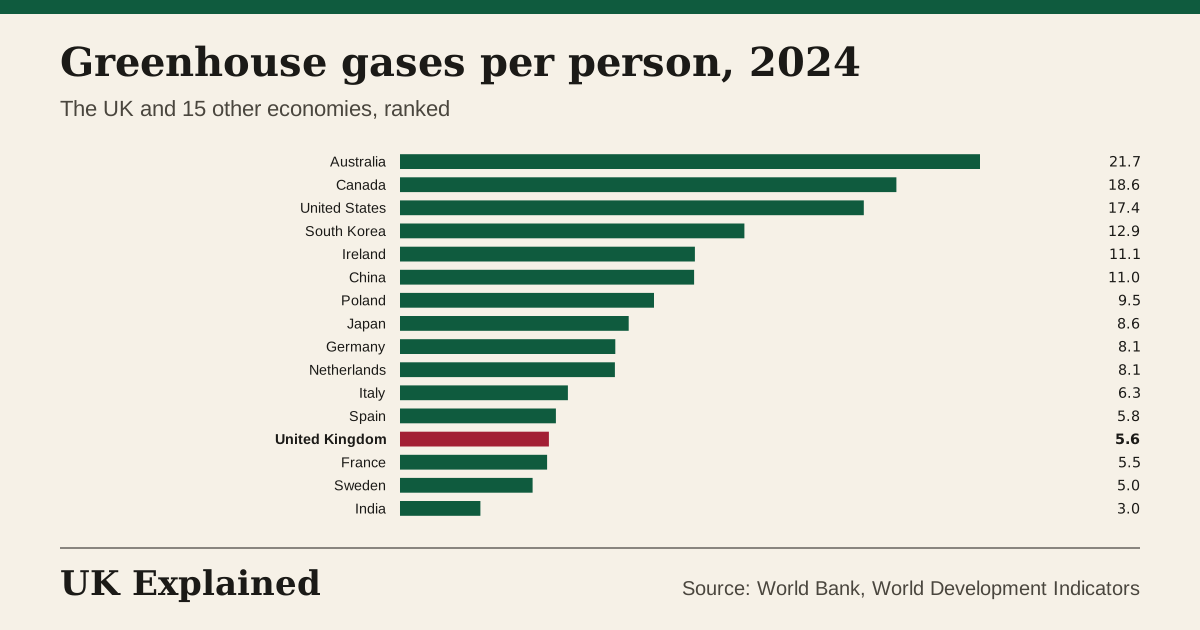
What it cannot tell you: It counts emissions made inside the country, not those from goods made abroad and bought there.
Fine particle air pollution, 2023: UK 8th of 16
The average level of tiny polluting particles (PM2.5) that people breathe in, which are linked to heart and lung disease. micrograms per cubic metre.
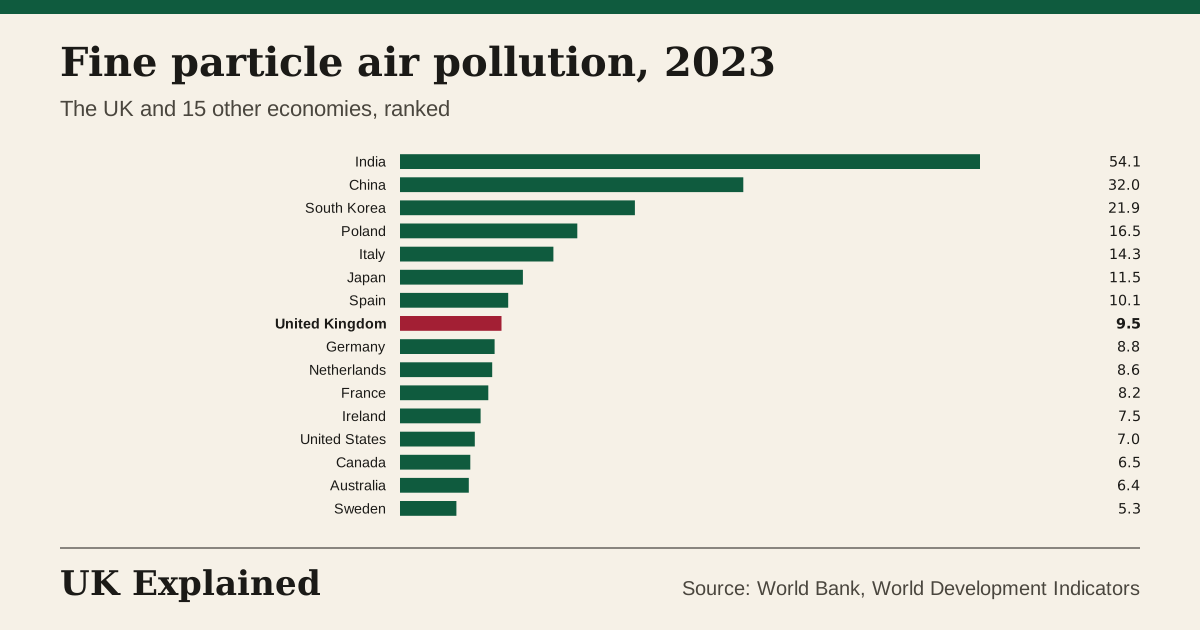
What it cannot tell you: It is a national average, so it hides the worst places, such as busy roads and cities.
Land covered by forest, 2023: UK 14th of 16
The share of a country's land area covered by forest. % of land.
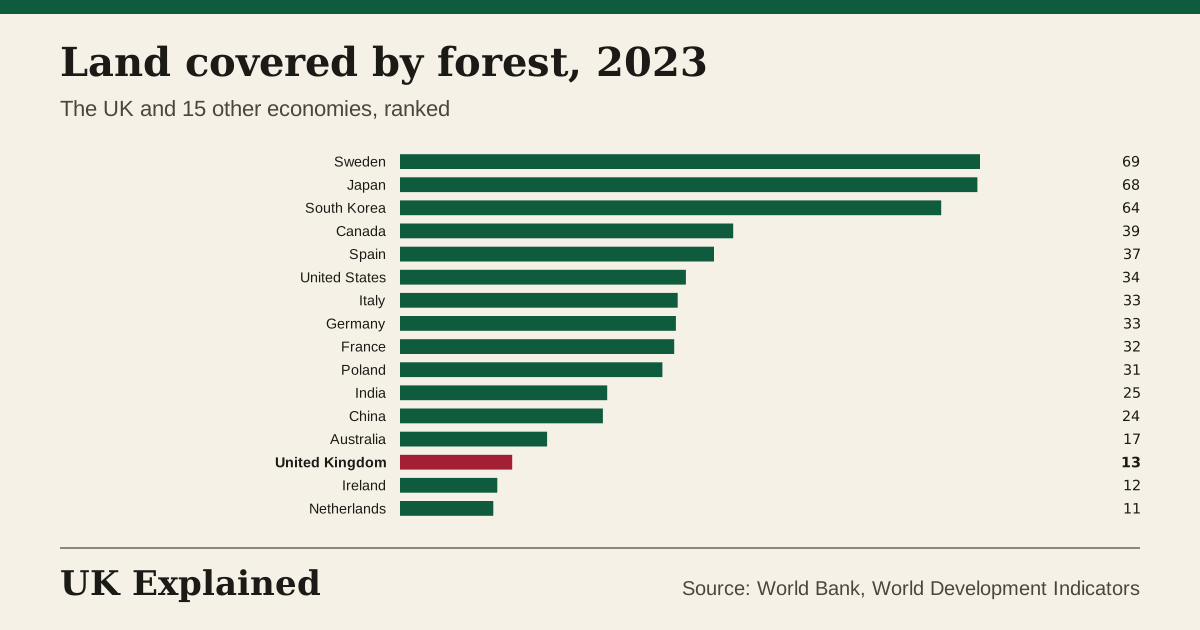
What it cannot tell you: It counts planted forests as well as natural woodland, so it does not show how rich in wildlife they are.
Questions people ask
How polluted is UK air?
Fine particle pollution (PM2.5) averaged 9.5 micrograms per cubic metre in 2023, 8th highest of the 16 economies we compare. The World Health Organization's guideline is 5.
How much of the UK is forest?
13% in 2023, against a middle of 33% for the other countries.
What does “uk: greenhouse gases per person” measure?
All greenhouse gases released in the country in a year, per person, counted as the carbon dioxide that would warm the Earth the same amount. It was 5.6 (tonnes of CO₂ equivalent) in 2024, down 20% on 2019. The highest we have is 13.7 (1991) and the lowest 5.6 (2024).
What does “uk: fine particle air pollution” measure?
The average level of tiny polluting particles (PM2.5) that people breathe in, which are linked to heart and lung disease. It was 9.5 (micrograms per cubic metre) in 2023, down 11% on 2018. The highest we have is 20.2 (1991) and the lowest 9.5 (2023).
Sources: World Bank, World Development Indicators and the World Bank. Updated every night. Each chart has a CSV and a Share button.
See also: UK emissions by sector · Energy against other countries