How many people live in the UK, and how fast is it growing?
About 69.5m people lived in the UK in mid-2025, up 7% on 2015 and up 4% on 2020. England had 58.83m, Scotland 5.55m, Wales 3.18m and Northern Ireland 1.93m.
Mid-2025. up 4% on 2020.
Mid-2025. up 7% on 2015.
Mid-2025. up 4% on 2015.
Population over time
What’s this?
The estimated number of people living in the UK in the middle of the year (30 June).
What it cannot tell you: It counts usual residents, so it can differ from other counts, and estimates are revised when new data arrive.
What’s this?
The estimated number of people living in England in the middle of the year.
What it cannot tell you: It counts usual residents and estimates are revised.
What’s this?
The estimated number of people living in Scotland in the middle of the year.
What it cannot tell you: It counts usual residents and estimates are revised.
What’s this?
The estimated number of people living in Wales in the middle of the year.
What it cannot tell you: It counts usual residents and estimates are revised.
What’s this?
The estimated number of people living in Northern Ireland in the middle of the year.
What it cannot tell you: It counts usual residents and estimates are revised.
Mid-year estimates
The ONS estimate for 30 June each year.
| Period | UK population | Population of England | Population of Scotland | Population of Wales | Population of Northern Ireland |
|---|---|---|---|---|---|
| 2025 | 69.5m | 58.83m | 5.55m | 3.18m | 1.93m |
| 2024 | 69.3m | 58.61m | 5.54m | 3.18m | 1.93m |
| 2023 | 68.6m | 57.99m | 5.51m | 3.17m | 1.92m |
| 2022 | 67.7m | 57.19m | 5.45m | 3.13m | 1.91m |
| 2021 | 67.0m | 56.55m | 5.41m | 3.11m | 1.90m |
| 2020 | 66.7m | 56.33m | 5.41m | 3.10m | 1.90m |
| 2019 | 66.6m | 56.23m | 5.41m | 3.09m | 1.90m |
| 2018 | 66.3m | 55.92m | 5.39m | 3.08m | 1.89m |
| 2017 | 66.0m | 55.62m | 5.39m | 3.08m | 1.88m |
| 2016 | 65.6m | 55.29m | 5.37m | 3.08m | 1.87m |
An ageing population, against other countries
Ranked, using the latest year the World Bank has for most of the 16 economies. The United Kingdom is picked out in the bar colour. Countries differ in size, climate and how they collect the figures, so a rank is a starting point, not a verdict.
People aged 65 and over, 2025: UK 11th of 16
The share of the population who are 65 or older. % of population.
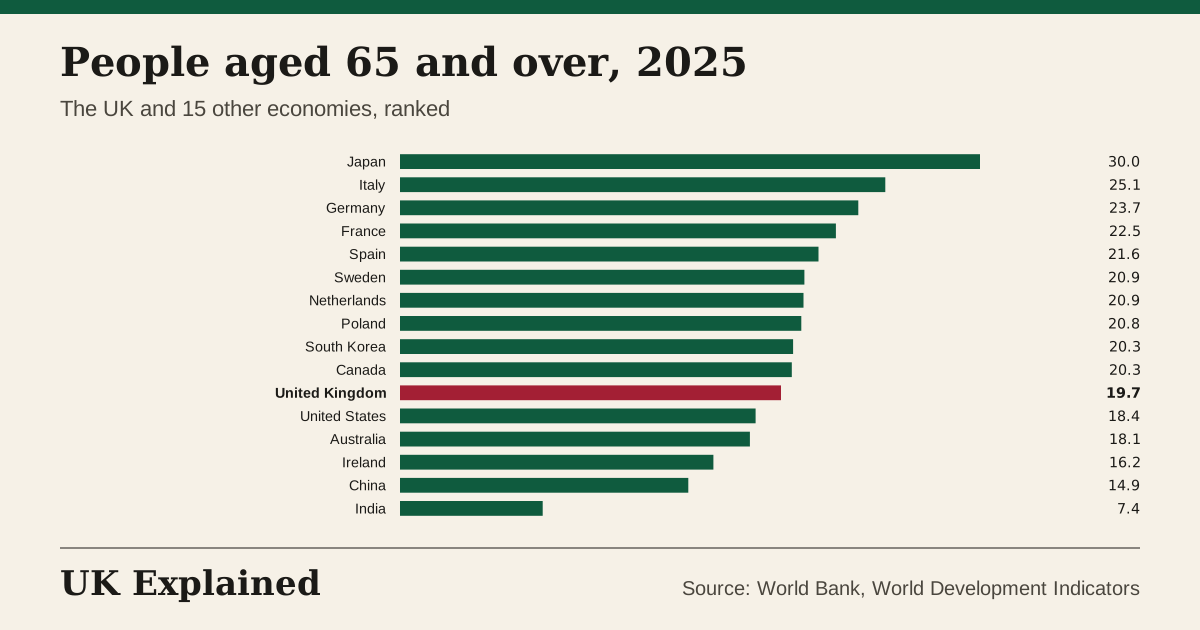
What it cannot tell you: It says nothing about health or independence in later life, or about how many younger people are available to work.
Questions people ask
How many people live in the UK?
The ONS estimates 69.5m people lived in the UK in mid-2025: England 58.83m, Scotland 5.55m, Wales 3.18m and Northern Ireland 1.93m.
Is the UK population growing?
It was 69.5m in 2025, up 4% since 2020 and up 7% since 2015. Population change comes from births, deaths and migration. See migration.
When does the ONS count the population?
The estimates are for 30 June each year. They are built from the 2021 Census and updated with birth, death, migration and administrative records, then revised when new data arrive.
What does “uk population” measure?
The estimated number of people living in the UK in the middle of the year (30 June). It was 69.5m (millions of people) in 2025, up 4% on 2020. The highest we have is 69.5m (2025) and the lowest 55.9m (1971).
What does “population of england” measure?
The estimated number of people living in England in the middle of the year. It was 58.83m (millions of people) in 2025, up 4% on 2020. The highest we have is 58.83m (2025) and the lowest 46.41m (1971).
What does “population of scotland” measure?
The estimated number of people living in Scotland in the middle of the year. It was 5.55m (millions of people) in 2025, up 3% on 2020. The highest we have is 5.55m (2025) and the lowest 5.06m (2000).
What does “population of wales” measure?
The estimated number of people living in Wales in the middle of the year. It was 3.18m (millions of people) in 2025, up 2% on 2020. The highest we have is 3.18m (2024) and the lowest 2.74m (1971).
Sources: ONS and the World Bank. Updated every night. Each chart has a CSV and a Share button.
See also: Population and spending per person