How many people come to live in the UK, and how many leave?
In the year to December 2025, an estimated 813,000 people came to live in the UK and 642,000 left, a net migration of 171,000. That is down from 891,000 in 2022. The latest figures are provisional.
Year to December 2025. Highest: 891,000 in 2022.
Came to live for at least a year, year to December 2025.
Left to live abroad for at least a year, year to December 2025.
Migration over time
What’s this?
The number of people who came to live in the UK minus the number who left, in the twelve months to the end of December. A minus sign means more left than arrived.
What it cannot tell you: These are modelled estimates, not a count: the ONS now combines Home Office visa records, tax and benefit records and surveys, and revises them as new data arrive. The latest figures are provisional.
What’s this?
The number of people who came to live in the UK for at least a year, in the twelve months to the end of December.
What it cannot tell you: These are modelled estimates, not a count: the ONS now combines Home Office visa records, tax and benefit records and surveys, and revises them as new data arrive. The latest figures are provisional.
What’s this?
The number of people who left the UK to live abroad for at least a year, in the twelve months to the end of December.
What it cannot tell you: These are modelled estimates, not a count: the ONS now combines Home Office visa records, tax and benefit records and surveys, and revises them as new data arrive. The latest figures are provisional.
Year by year
Twelve months to December each year. Provisional for the latest years.
| Period | People coming to live in the UK | People leaving the UK to live abroad | Net migration to the UK |
|---|---|---|---|
| 2025 | 813,000 | 642,000 | 171,000 |
| 2024 | 1,012,000 | 680,000 | 331,000 |
| 2023 | 1,441,000 | 593,000 | 848,000 |
| 2022 | 1,398,000 | 508,000 | 891,000 |
| 2021 | 947,000 | 480,000 | 467,000 |
| 2020 | 662,000 | 569,000 | 93,000 |
| 2019 | 788,000 | 605,000 | 184,000 |
| 2018 | 825,000 | 549,000 | 276,000 |
| 2017 | 752,000 | 544,000 | 208,000 |
| 2016 | 772,000 | 523,000 | 249,000 |
Net migration, against other countries
Ranked, using the latest year the World Bank has for most of the 16 economies. The United Kingdom is picked out in the bar colour. Countries differ in size, climate and how they collect the figures, so a rank is a starting point, not a verdict.
Net migration over five years, 2025: UK 2nd of 16
How many more people moved to a country than left it over a five-year period (a minus sign means more left than arrived). The World Bank estimates it from population changes. people over five years.
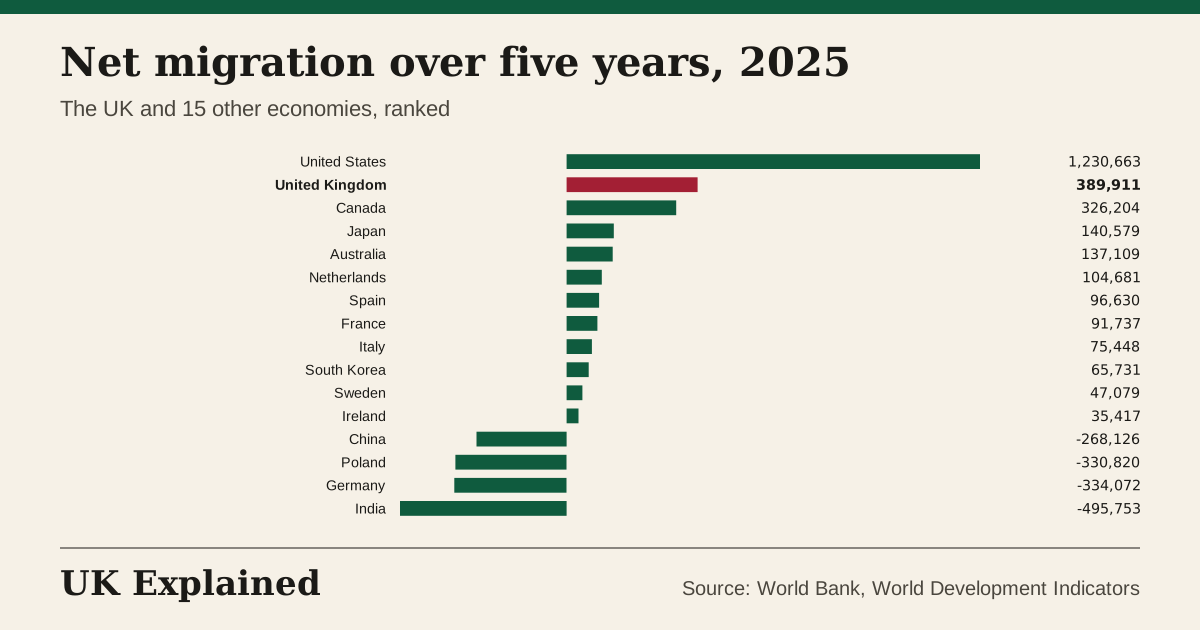
What it cannot tell you: It is a model-based estimate over five years, not a count, and it does not show who moved or why.
Questions people ask
What is net migration?
The number of people who come to live in the country for at least a year minus the number who leave for at least a year. In the year to December 2025 it was 171,000.
How many people move to the UK each year?
An estimated 813,000 came to live in the UK in the year to December 2025, against 1,441,000 at the highest point (2023).
Why are the numbers revised?
Since 2021 the ONS has switched from the old International Passenger Survey to estimates built from visa, border, tax and benefit records. Provisional numbers are revised when more data arrive, sometimes by a lot.
How many people claim asylum?
See asylum claims. They are counted separately by the Home Office.
What does “net migration to the uk” measure?
The number of people who came to live in the UK minus the number who left, in the twelve months to the end of December. A minus sign means more left than arrived. It was 171,000 (people a year) in 2025, up 84% on 2020. The highest we have is 891,000 (2022) and the lowest 93,000 (2020).
What does “people coming to live in the uk” measure?
The number of people who came to live in the UK for at least a year, in the twelve months to the end of December. It was 813,000 (people a year) in 2025, up 23% on 2020. The highest we have is 1,441,000 (2023) and the lowest 643,000 (2012).
What does “people leaving the uk to live abroad” measure?
The number of people who left the UK to live abroad for at least a year, in the twelve months to the end of December. It was 642,000 (people a year) in 2025, up 13% on 2020. The highest we have is 680,000 (2024) and the lowest 448,000 (2012).
Sources: ONS, Long-term international migration, provisional and the World Bank. Updated every night. Each chart has a CSV and a Share button.
See also: Population over time